The illustrious sweet spot… It’s as hard to find as a needle in a haystack. We hear the term in coaches offices, gym floors and training rooms all the time, yet it remains so hard to quantify, that many people believe at this point it’s a myth.
Common sense tells us that if we are underprepared for activity then we are not only at risk of injury because we cannot cope with the demands placed on us but also of underperformance because we simply are not sharp enough. The complete opposite is true also, if we have over prepared we risk fatigue, burnout and subsequent injury risk but similarly we also risk underperformance due to the accumulation of fatigue and central nervous system overload.
So if both of these statements are true, then the sweet spot is somewhere in between. Finding this happy medium is the holy grail, but we must remember that what looks simple from the outside is always more complex when we pull back the curtains.
This sweet spot is most likely different for each positional group and subsequently is different for each athlete. And to make things even more complex, to avoid monotony we know that we must be overreaching athletes, we must be willing to delve outside the sweet spot at certain times to push athletes forward, make gains and drive performance.
With this in mind, understanding what this sweet spot looks like and understanding the risks on either side becomes more and more important. This data can be the foundation of periodisation for us and can allow us as coaches to plan safely and appropriately to help drive performance, reduce risk and individualise each athletes plans to reflect their needs and the schedule of the team.
These insights demonstrate the data we have been delivering to teams to help them to develop their performance paradigm and drive data driven programming to improve performance. There is gold in your data, it doesn’t have to be a mystery and we can help you find it!
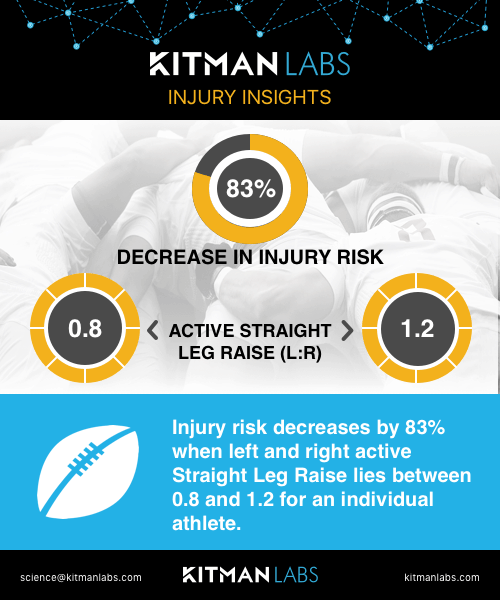
- What metrics help you strike the right balance? Decreasing asymmetries mitigates injury risk, an example from #rugbyleague. #sweetspot #gameofinsights #slr
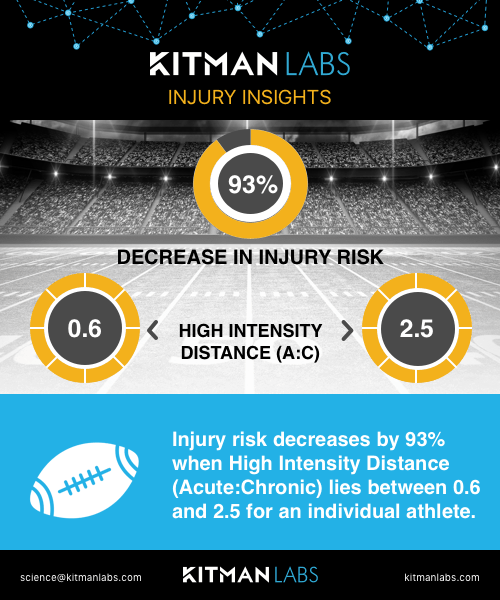
- How well do your thresholds work for injury risk? Here’s an example from #americanfootball with sweet results! #sweetspot #gameofinsights #highintensity
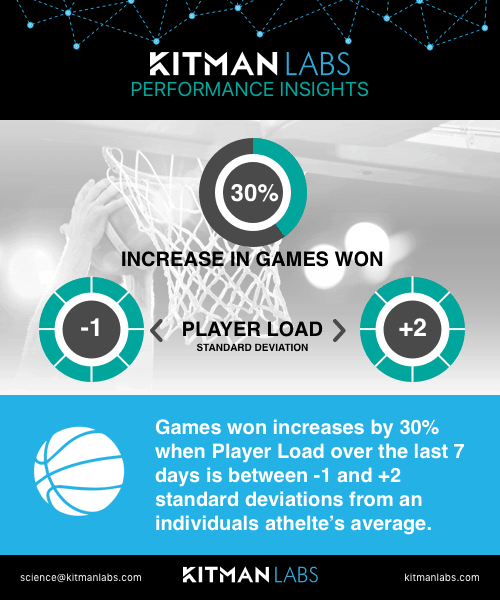
- How do you set your thresholds for performance? This #basketball team could use standard deviations. #sweetspot #gameofinsights #playerload
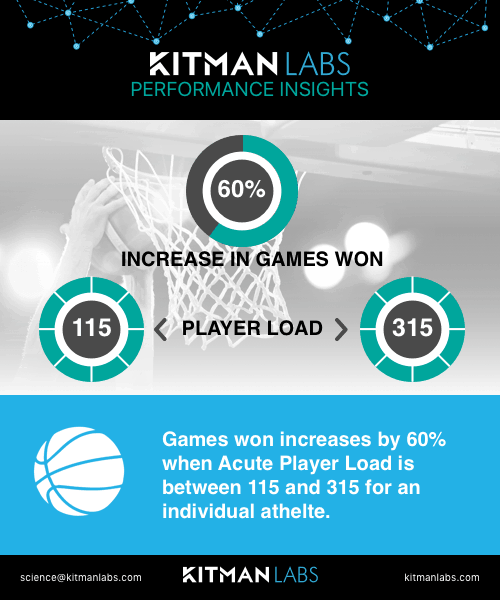
- How do you set your thresholds for performance? This #basketball team could use daily absolutes. #sweetspot #gameofinsights #acuteplayerload
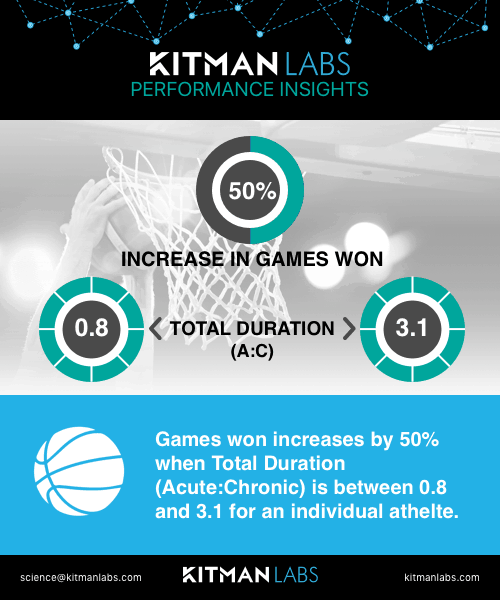
- How does your training have the most impact on performance? Have you found the #sweetspot #gameofinsights #totalduration #basketball
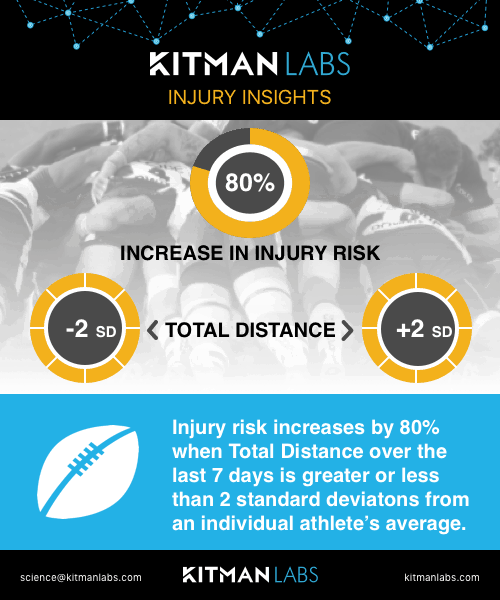
- Have you found a magic number? It’s 2 for this #rugby team! #sweetspot #gameofinsights #totaldistance


 More than Equal’s mission is to close the gender gap in motor sports and find and develop the first female Formula 1 world champion. They will now have an advanced operating system to centralize data for female drivers participating in More than Equal’s pioneering Development Programme.