A consistent top five club in Liga Portugal, S.C Braga is investing to further advance their league position by focusing on enhancing their youth development program and elevating first team on-field performance. To achieve these goals, S.C. Braga upgraded their academy and first team facilities and invested in growing an interconnected dataset with an Intelligence Platform to support in-house research and evidence-based player management.
Research Study Background
For the last 7 years, Braga SC has been using Creatine Kinase (CK) testing to support player load management decisions.
Creatine Kinase is a blood marker used to identify muscle damage. Creatine Kinase testing is a commonly used method of assessing muscle damage and player fatigue in sport, and a key part of the player load management strategy for many clubs. However the test requires blood samples, which is invasive, time consuming, and expensive. Ideally practitioners would have access to the information from the test without players having to take the test.
To help inform when to alter player load, Braga started collecting CK data in 2017, but contained CK testing to congested periods, within 48 hours of a game. They limited its use due to the invasiveness and the work required by staff to complete the testing and the relative importance of managing players correctly in these periods is also far greater.
Braga was interested in combining CK testing with other metrics to support evidence-based player load management at all points in the season. This led them to partner with Kitman Labs to investigate if a link exists between physical metrics (GPS, wellness etc) and changes in player CK levels.
1. Understanding Braga’s Historical CK Data
Data Health
The first step was to assess the quality of the data. Clean, accurate data is essential to the reliability of the study. The Kitman Labs data science team evaluated Braga’s entire dataset, from injury to GPS data in order to identify any inconsistencies within the data, gaps, extreme values, and worked with Braga’s team to address any of the issues.
This was an opportunity to collaborate with Braga to gather as much context on the data as possible, which supports more informed decisions and assumptions made during the analysis. For example, during the modelling process, the team identified that a change in how the CK values metrics were collected within the last two seasons was impacting the model, and shifted the analysis to only include those last two seasons.
Descriptive Analysis
The next step was to understand Braga’s current use of the CK values. The data science team evaluated both absolute values and the change in CK value (with respect to their own historical values).
The analysis investigated the relationship between CK values, and changes in CK, and other factors such as the level of congestion, previous games minutes and injury history, with no significant findings from these.
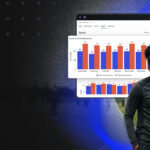
Another area of interest was how CK varied across the season. As a measure of muscle damage, a level of change in CK values across a season might show that players get more muscle damage from the same amount of load later in the year – a cumulative load effect. The team analzyed the percentage change in Creatine Kinase levels with respect to players’ historical mean values. And, while there is no evidence in the literature of an age effect on CK levels, the analysis investigated the relationship between cumulative load and age in combination.
We found that the CK change for players aged 29 or more steadily increases over the course of the season. Overall change in CK values is highest at Q4/end of season for players over 25 (Figure 1).
The insight from these descriptive analyses informed the features that were engineered to model CK using GPS metrics in the next stage.
2. Identifying the drivers of changes in CK values
The starting point was to collaborate with Braga to identify a CK metric and threshold for that metric that would initiate an intervention by Braga staff. This metric and value would be the comparative point to find the other metrics and thresholds that could be used as proxies for CK. Change in CK was chosen as the metric over raw CK values as 1) Braga was already using change to determine when to intervene and 2) it more accurately captures each player’s individual response to load, which leads to better results.
This formulated the initial research classification problem: “What are the drivers of % change in CK level above a certain threshold?”
To find the optimal % change threshold, Kitman Labs and Braga collaborated to identify the thresholds Braga used to inform interventions. This was informed by CK- related research¹published by Braga practitioners, as well as creating a model for varying thresholds and comparing the performance of each one using ROC AUC, CAP curves, and other metrics. The best performing model was a threshold of 50%.
This solidified the final research question – “Which metrics contribute to % change in CK levels > 50%?”
In the next step, the team established a multivariate model using the GPS and wellness metrics stored in Braga’s Intelligence Platform. GPS is collected via API, while all wellness metrics are captured via the Kitman Labs Athlete app.
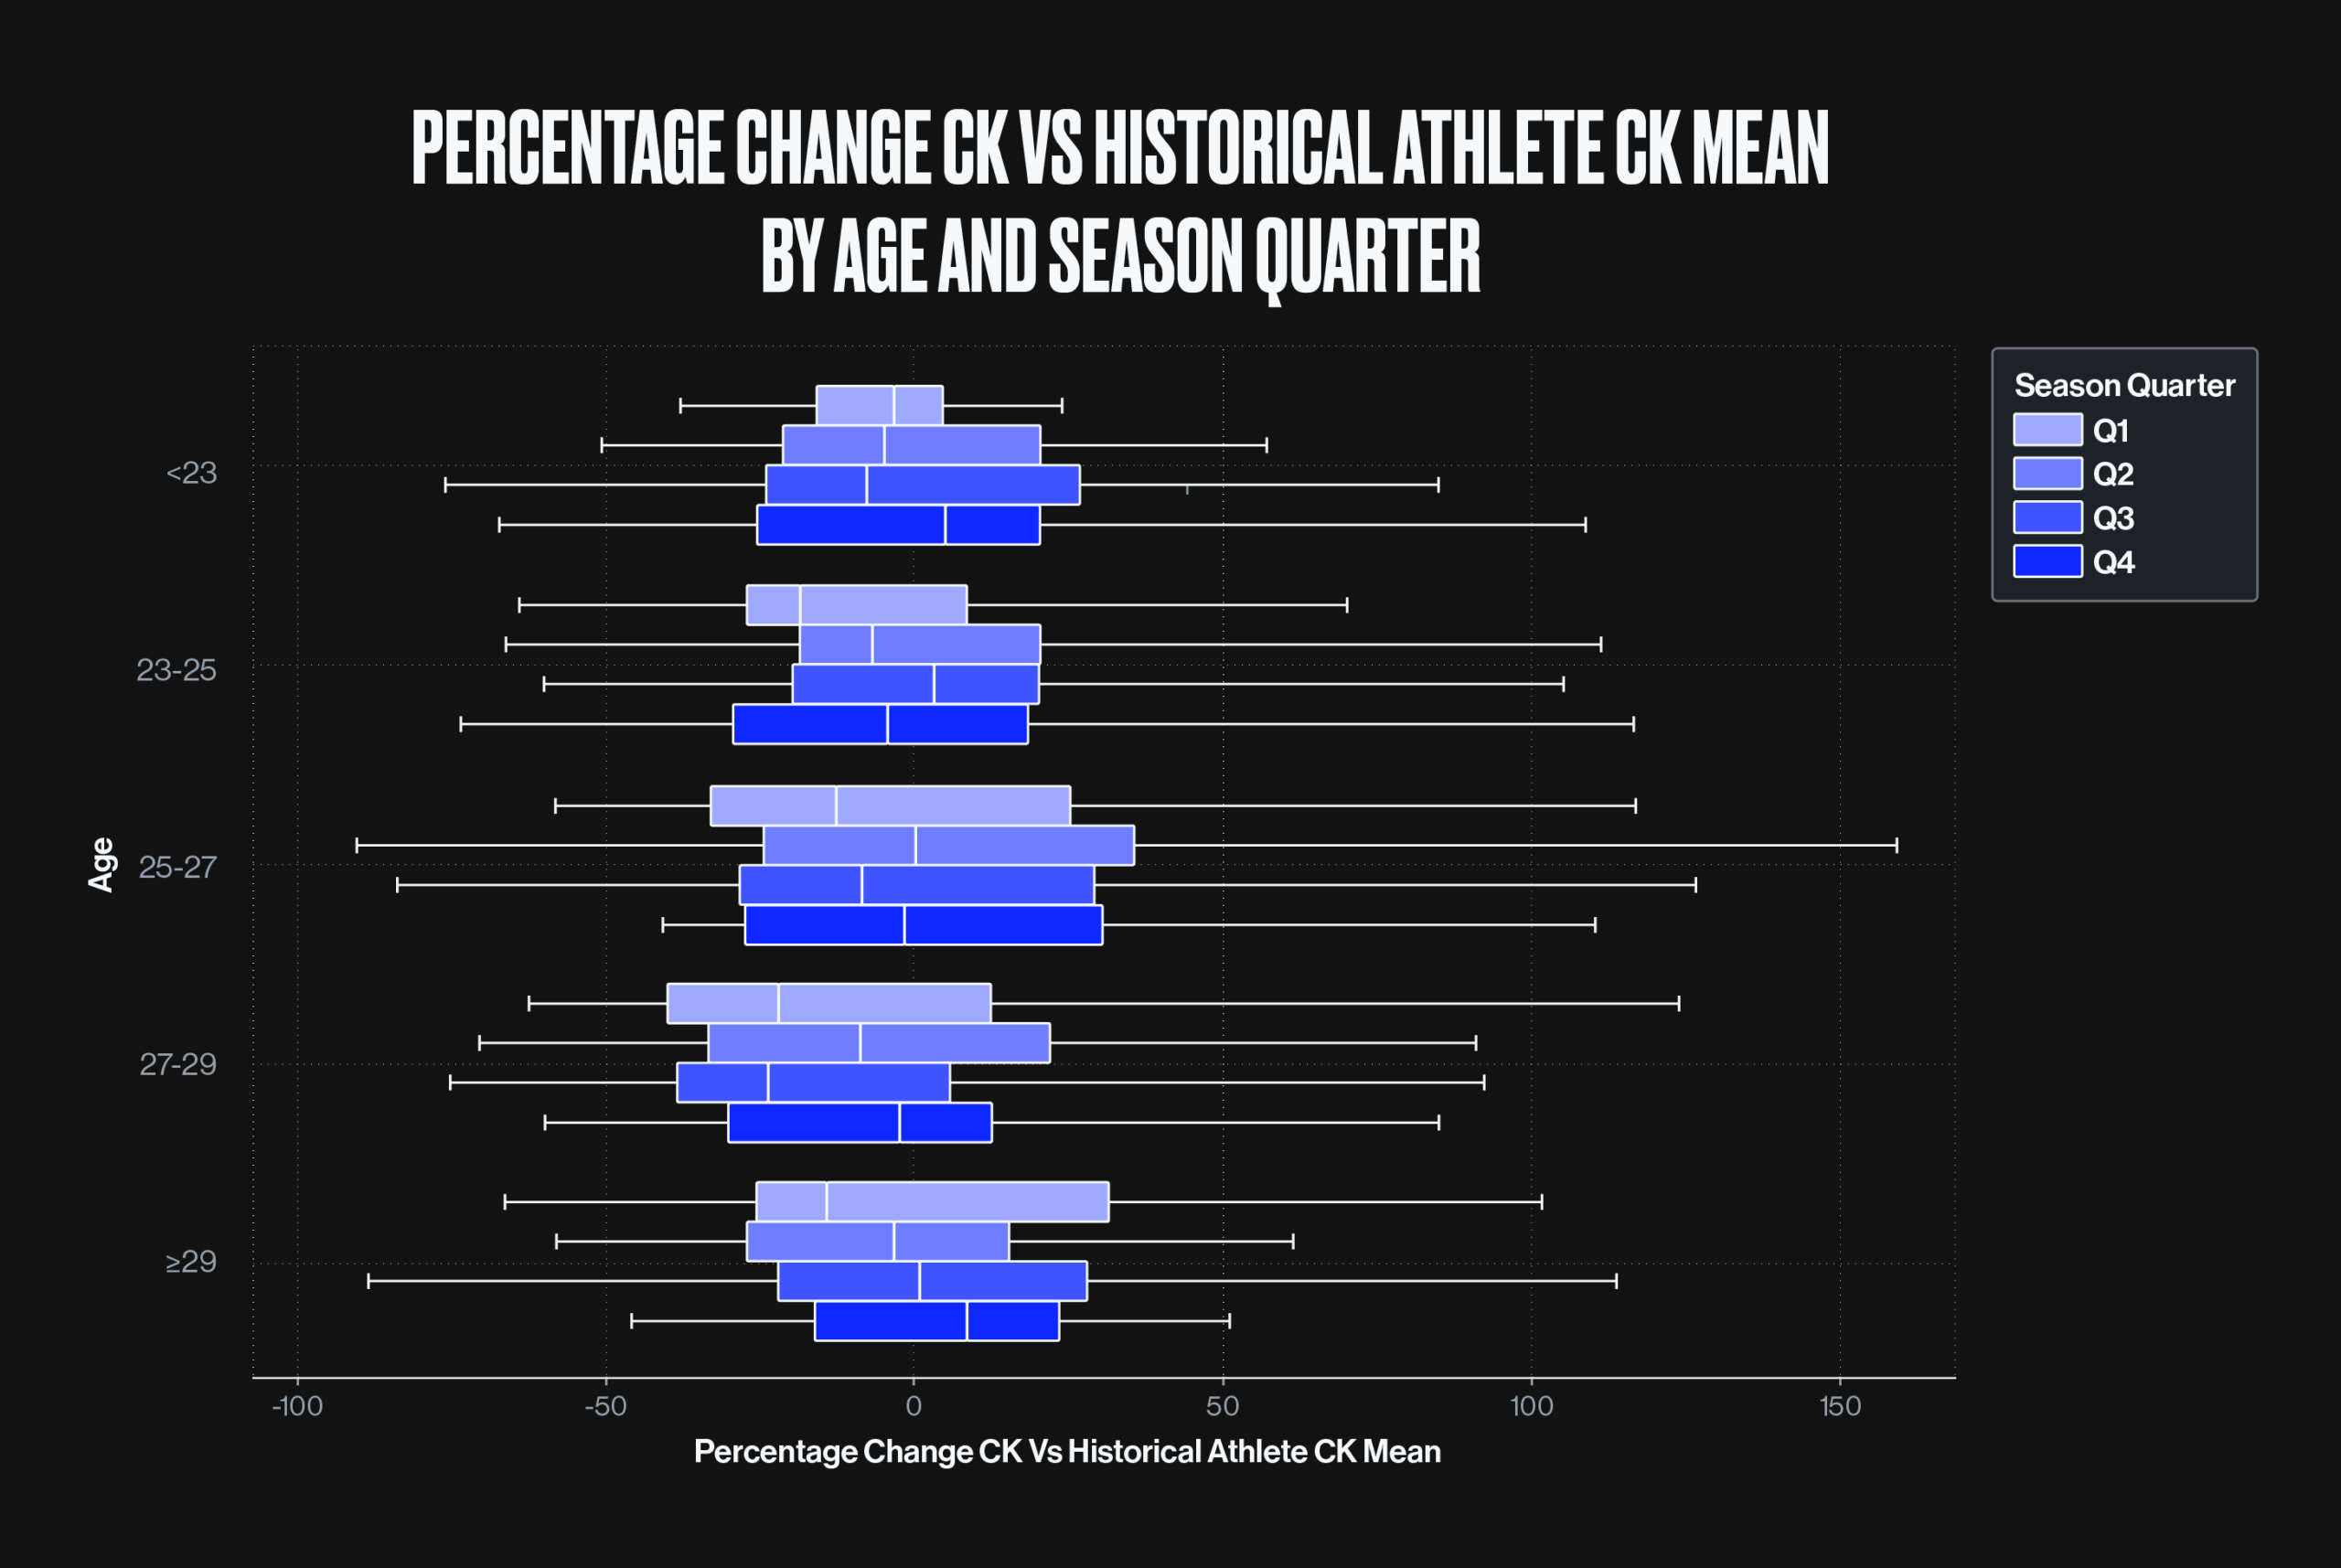
To identify the most important metrics we used the SHAP explainable AI technique (Figure 2). The model performance is very good (ROC AUC: 89%²) having been assessed under a number of evaluation metrics.
3. Results
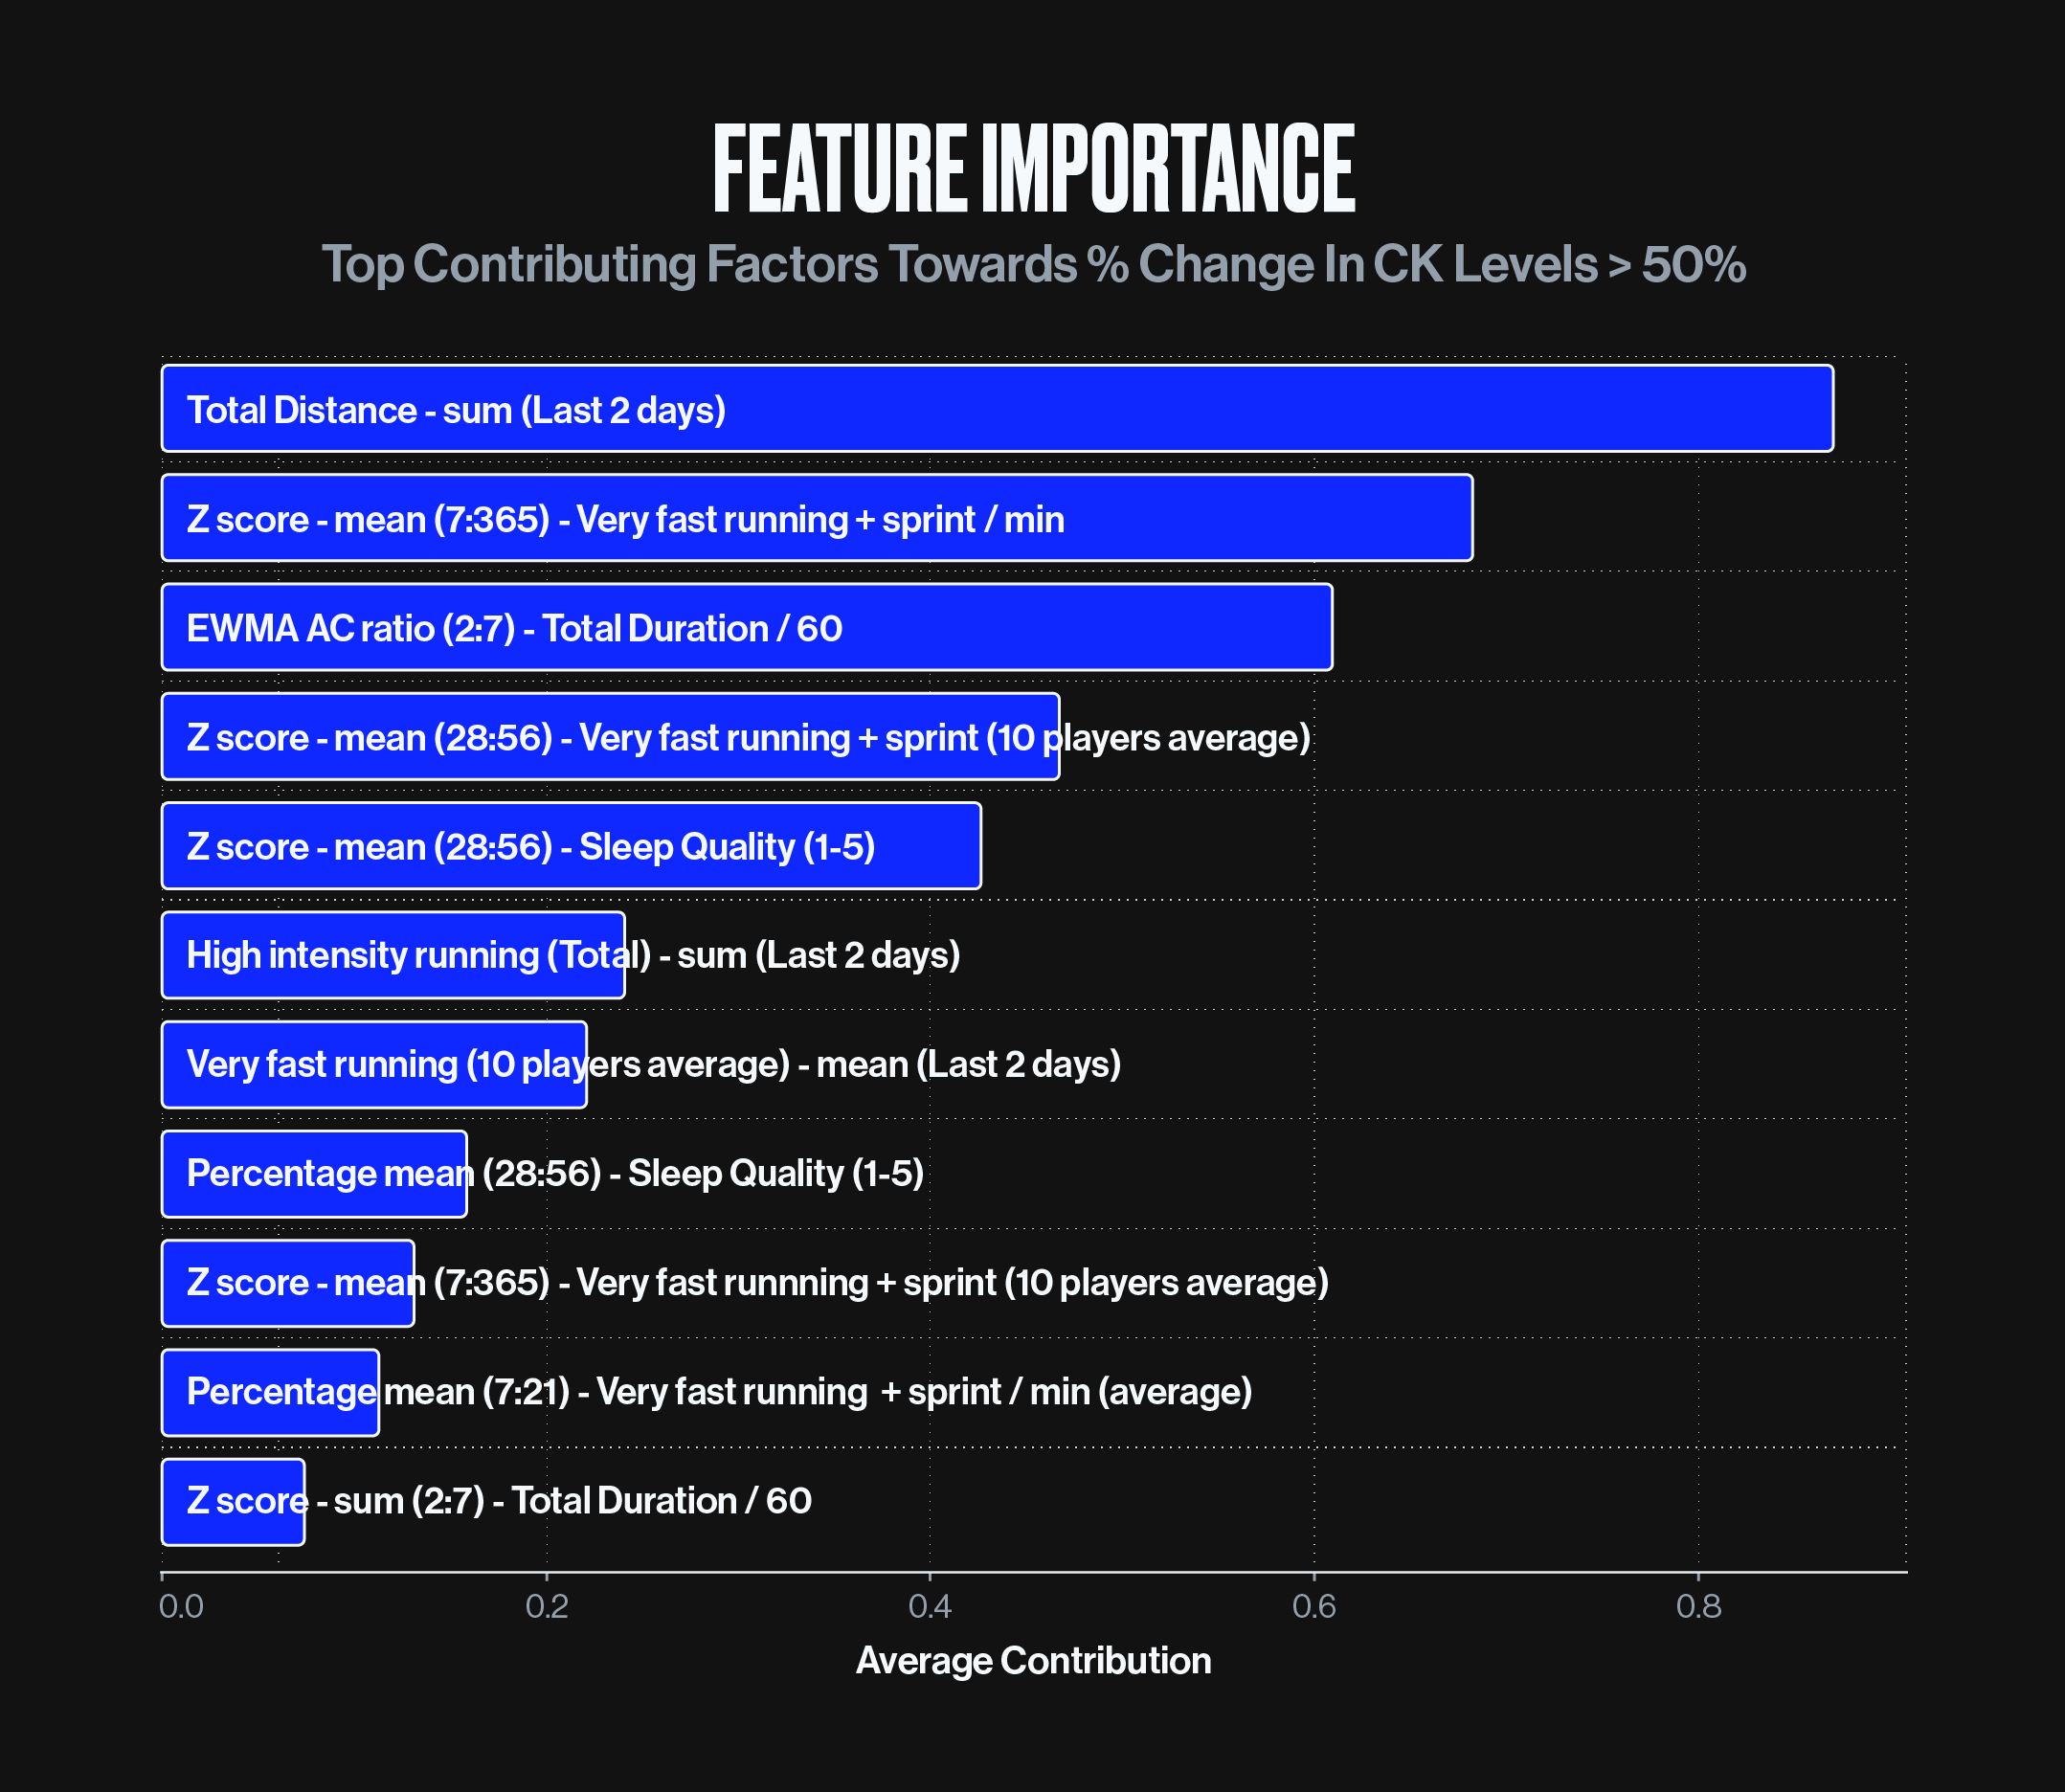
The top contributing factor to change in CK was the cumulative total distance a player had undertaken in the preceding 2 days, with distances above ~11km.
This is unsurprising as that level roughly corresponds to a typical game distance, so the model is essentially picking up the players that have participated in a full game in the last 2 days.
Other notable metrics contributing to CK changes above 50% included:
- Increases in the amount of Total Duration, which is closely related to the total distance undertaken by an athlete
- Increased Sprint Distance and
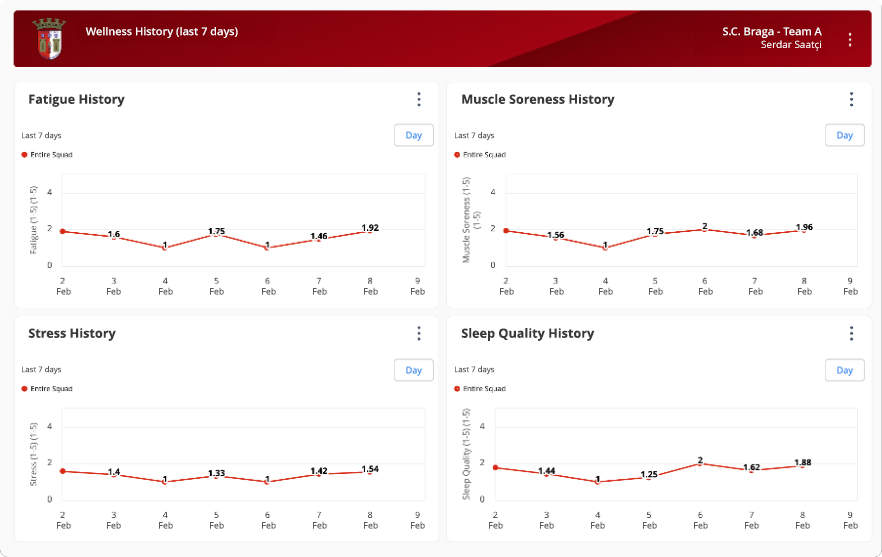
- Deterioration of Sleep Quality
Insights to Action – Monitoring the New Metrics
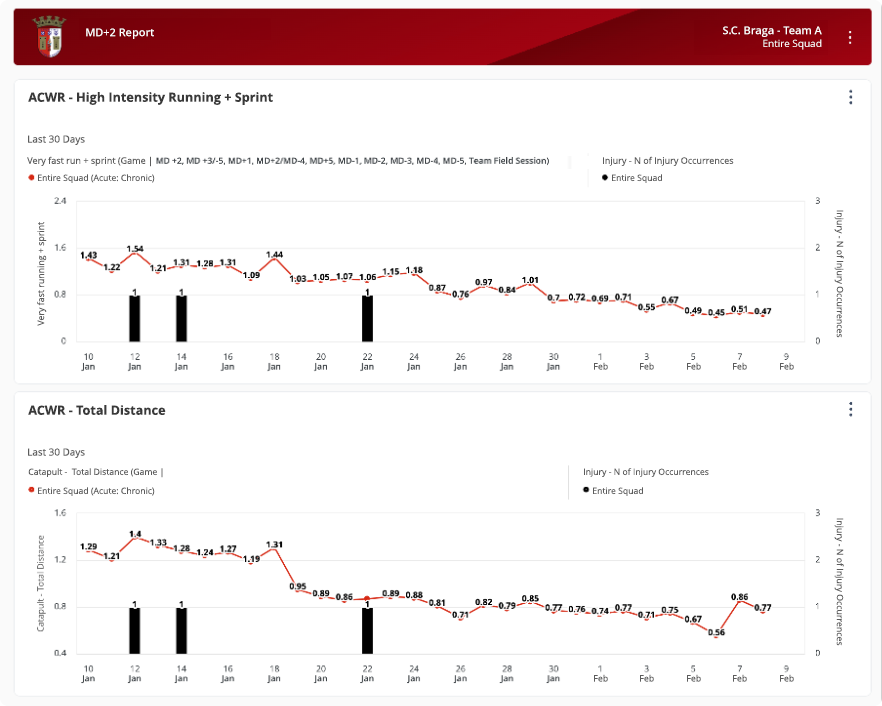
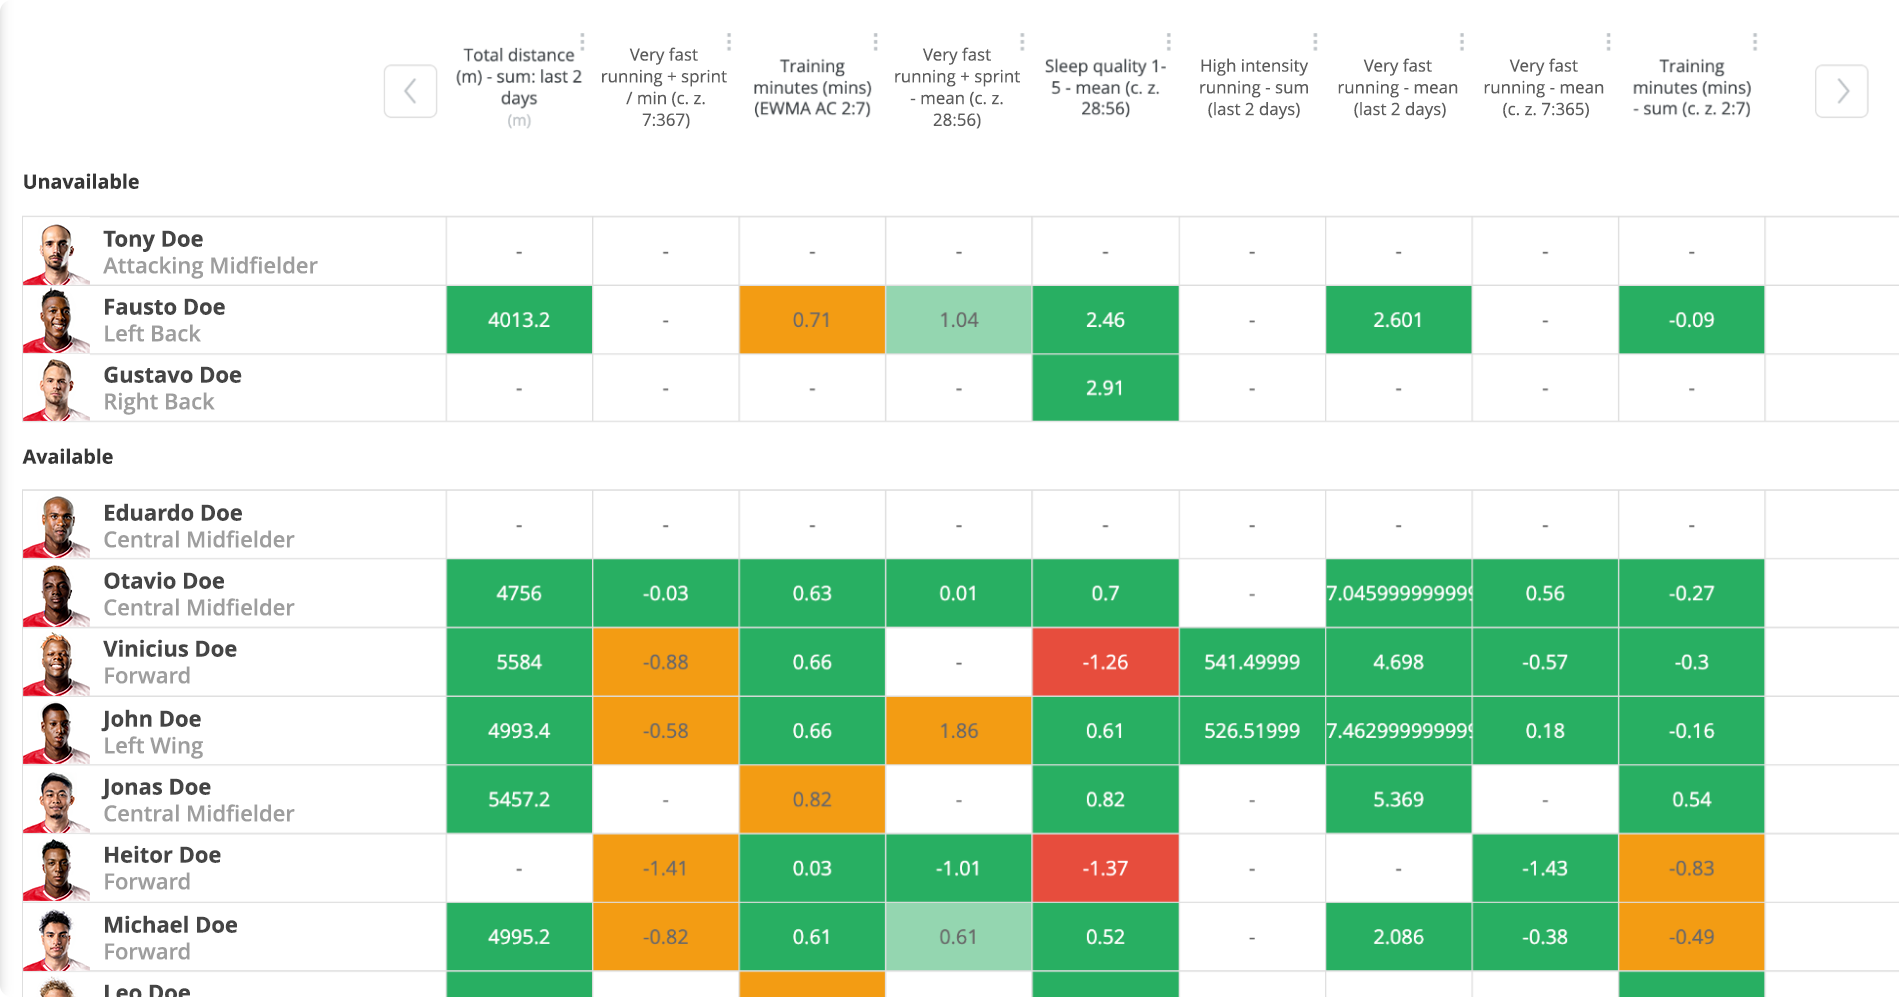
Using their iP: Intelligence Platform, Braga staff created various dashboards to monitor the top contributing factors, with alerting thresholds set based on the model results (Figure 4), and also taking into consideration the age-based results. They have also created a MD+2 Analysis dashboard to manage player load (Figure 5).
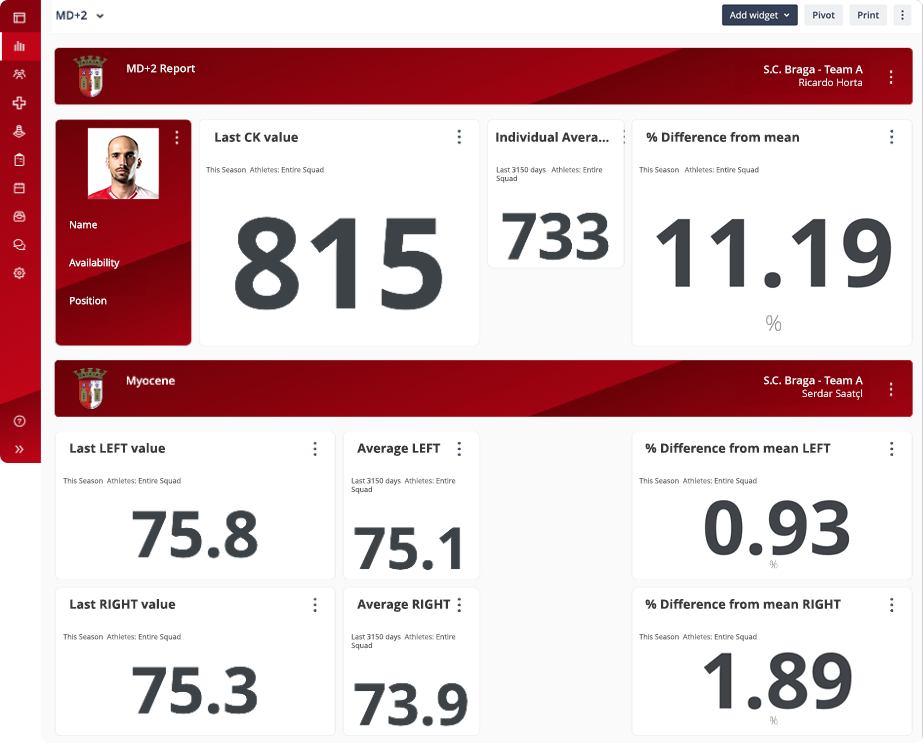   |
|
Figure 4: Athlete Metrics in Braga’s Intelligence Platform to actively monitor the top contributing factors, with alerting thresholds set based on the model results.
|
Next
From this study the importance of collecting and centralizing more data came to the fore. With the Intelligence Platform in place, Braga now has the infrastructure to support consistent, high quality data collection from myriad data sources and centralize it into a single platform for more rapid and robust analytics. This will allow Braga to research a wider scope of metrics.
Braga continues to collect CK values during congested periods with the aim to re-run the analysis. The results would put them in a position to have a broader set of evidence-based metrics that are less invasive, time consuming and costly to better manage players at all points of the season.
¹ Individual-based Creatine Kinase Reference Values in Response to Soccer Match-play
João Ribeiro, Petrus Gantois, Vitor Moreira, Francisco Miranda, Nuno Romano, Fábio Yuzo Nakamura
PMID: 35000188 DOI: 10.1055/a-1678-7340
² ROC AUC: the area under the ROC curve is a popular way to assess the quality of a binary classification model.
The ROC curve plots the true positive rate against the false positive rate for a range of detection thresholds. The area under this curve for a perfect model is 1 while a completely random model would be 0.5.