What You Will Find Here
Below you’ll find the historical norms for every NFL position to easily reference where an athlete currently taking part in the NFL Combine sits in relation to previous draft picks. They are based on 12 years worth of historical values (2010 to 2021) and a sample of 3101 athletes. Data from previous NFL Combines was sourced from nflcombineresults.com, and the NFL Draft data from kaggle.
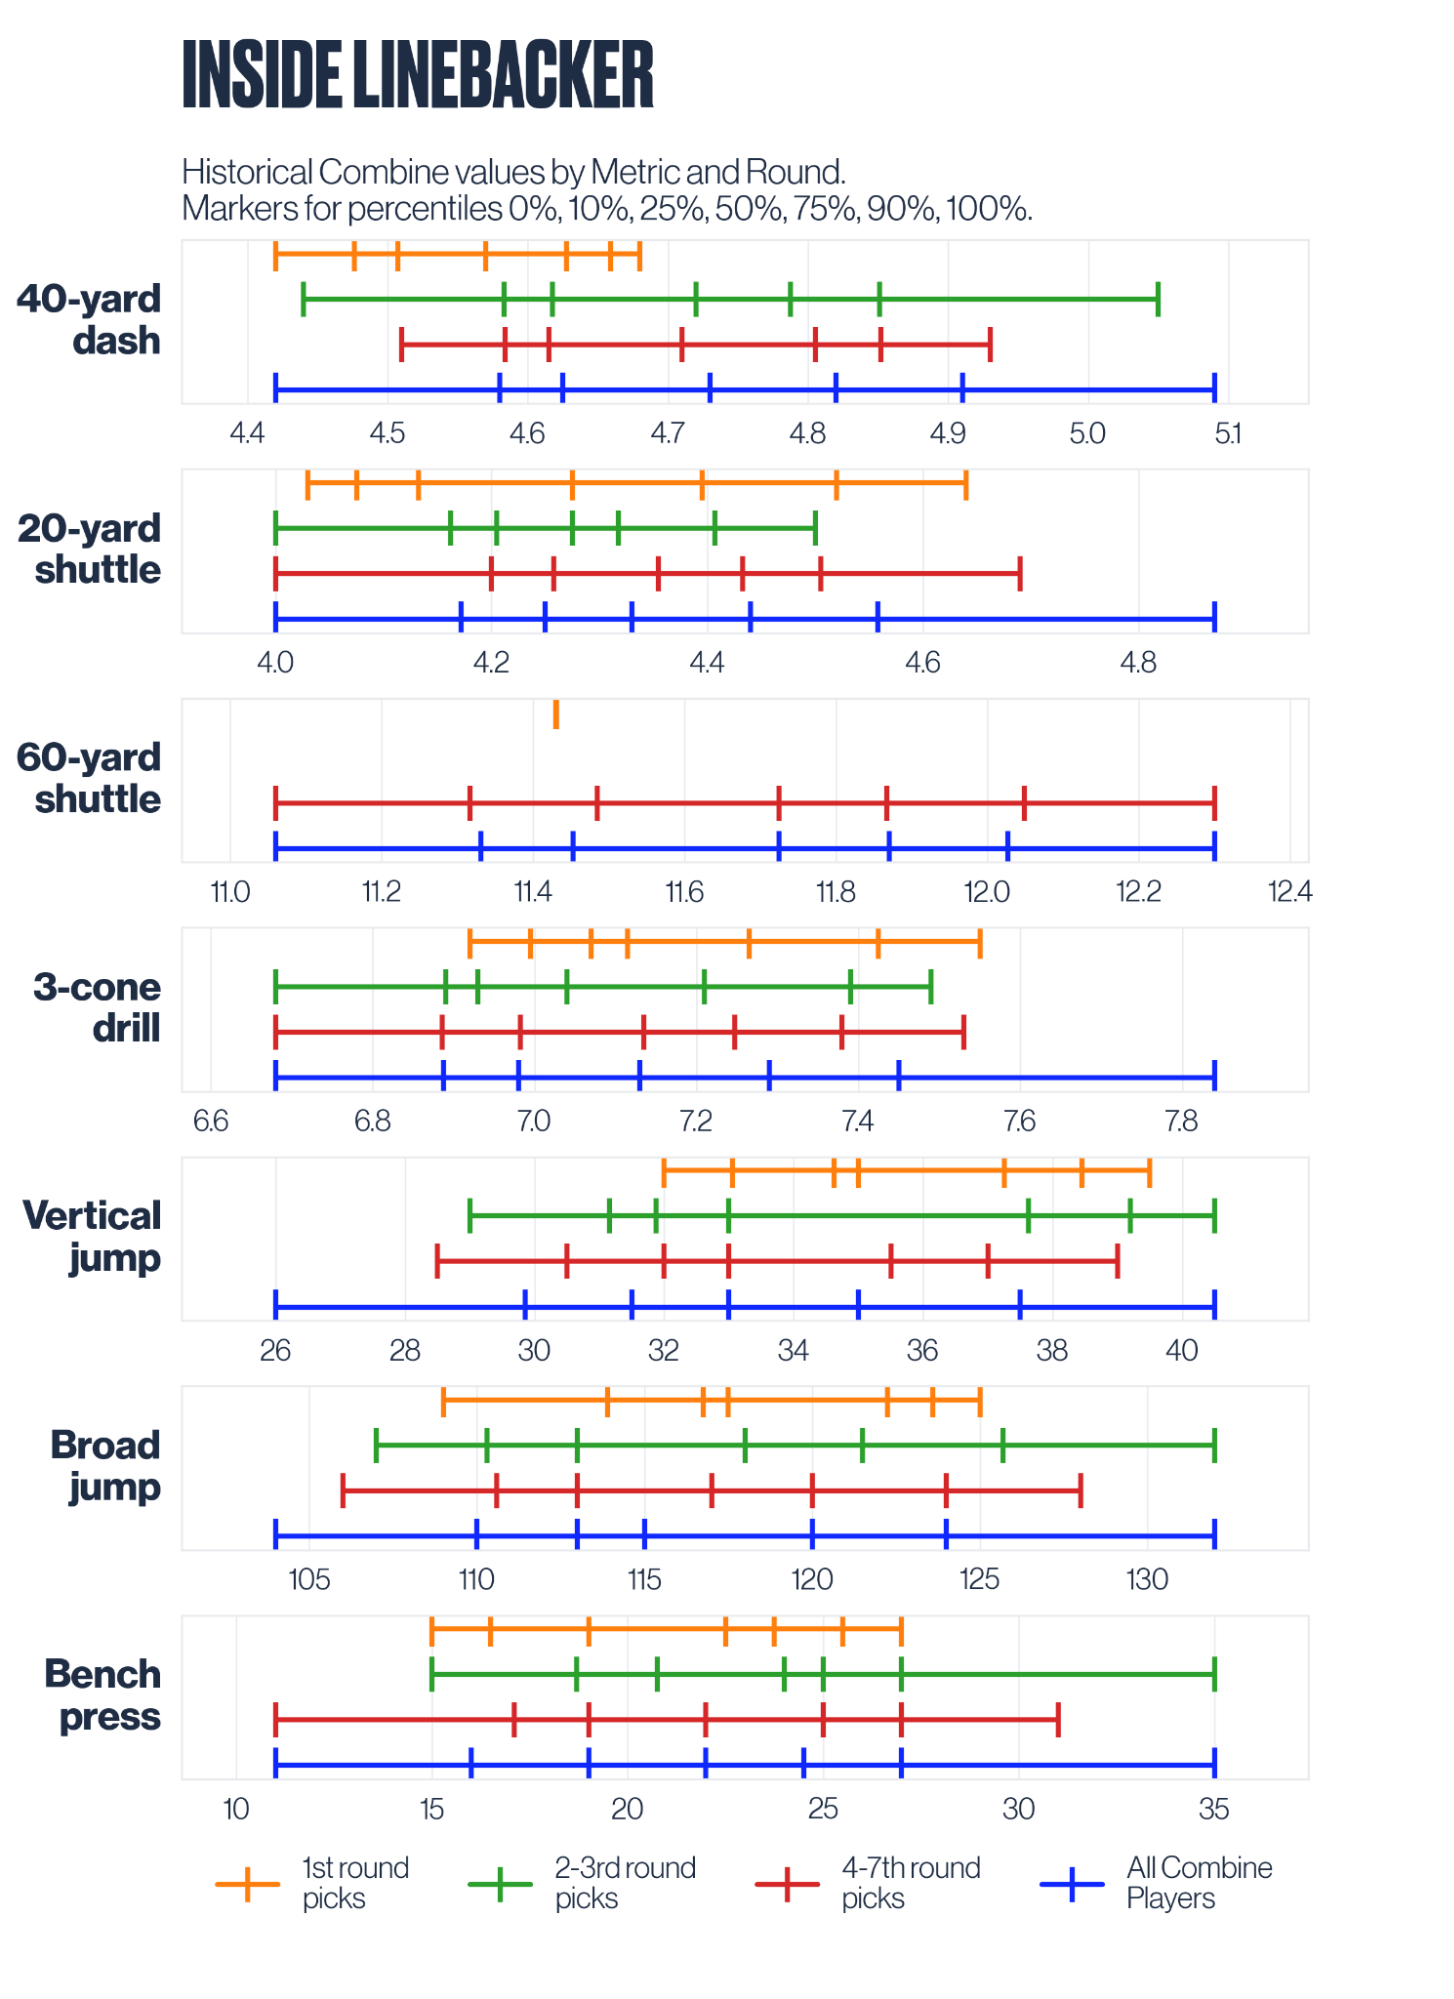
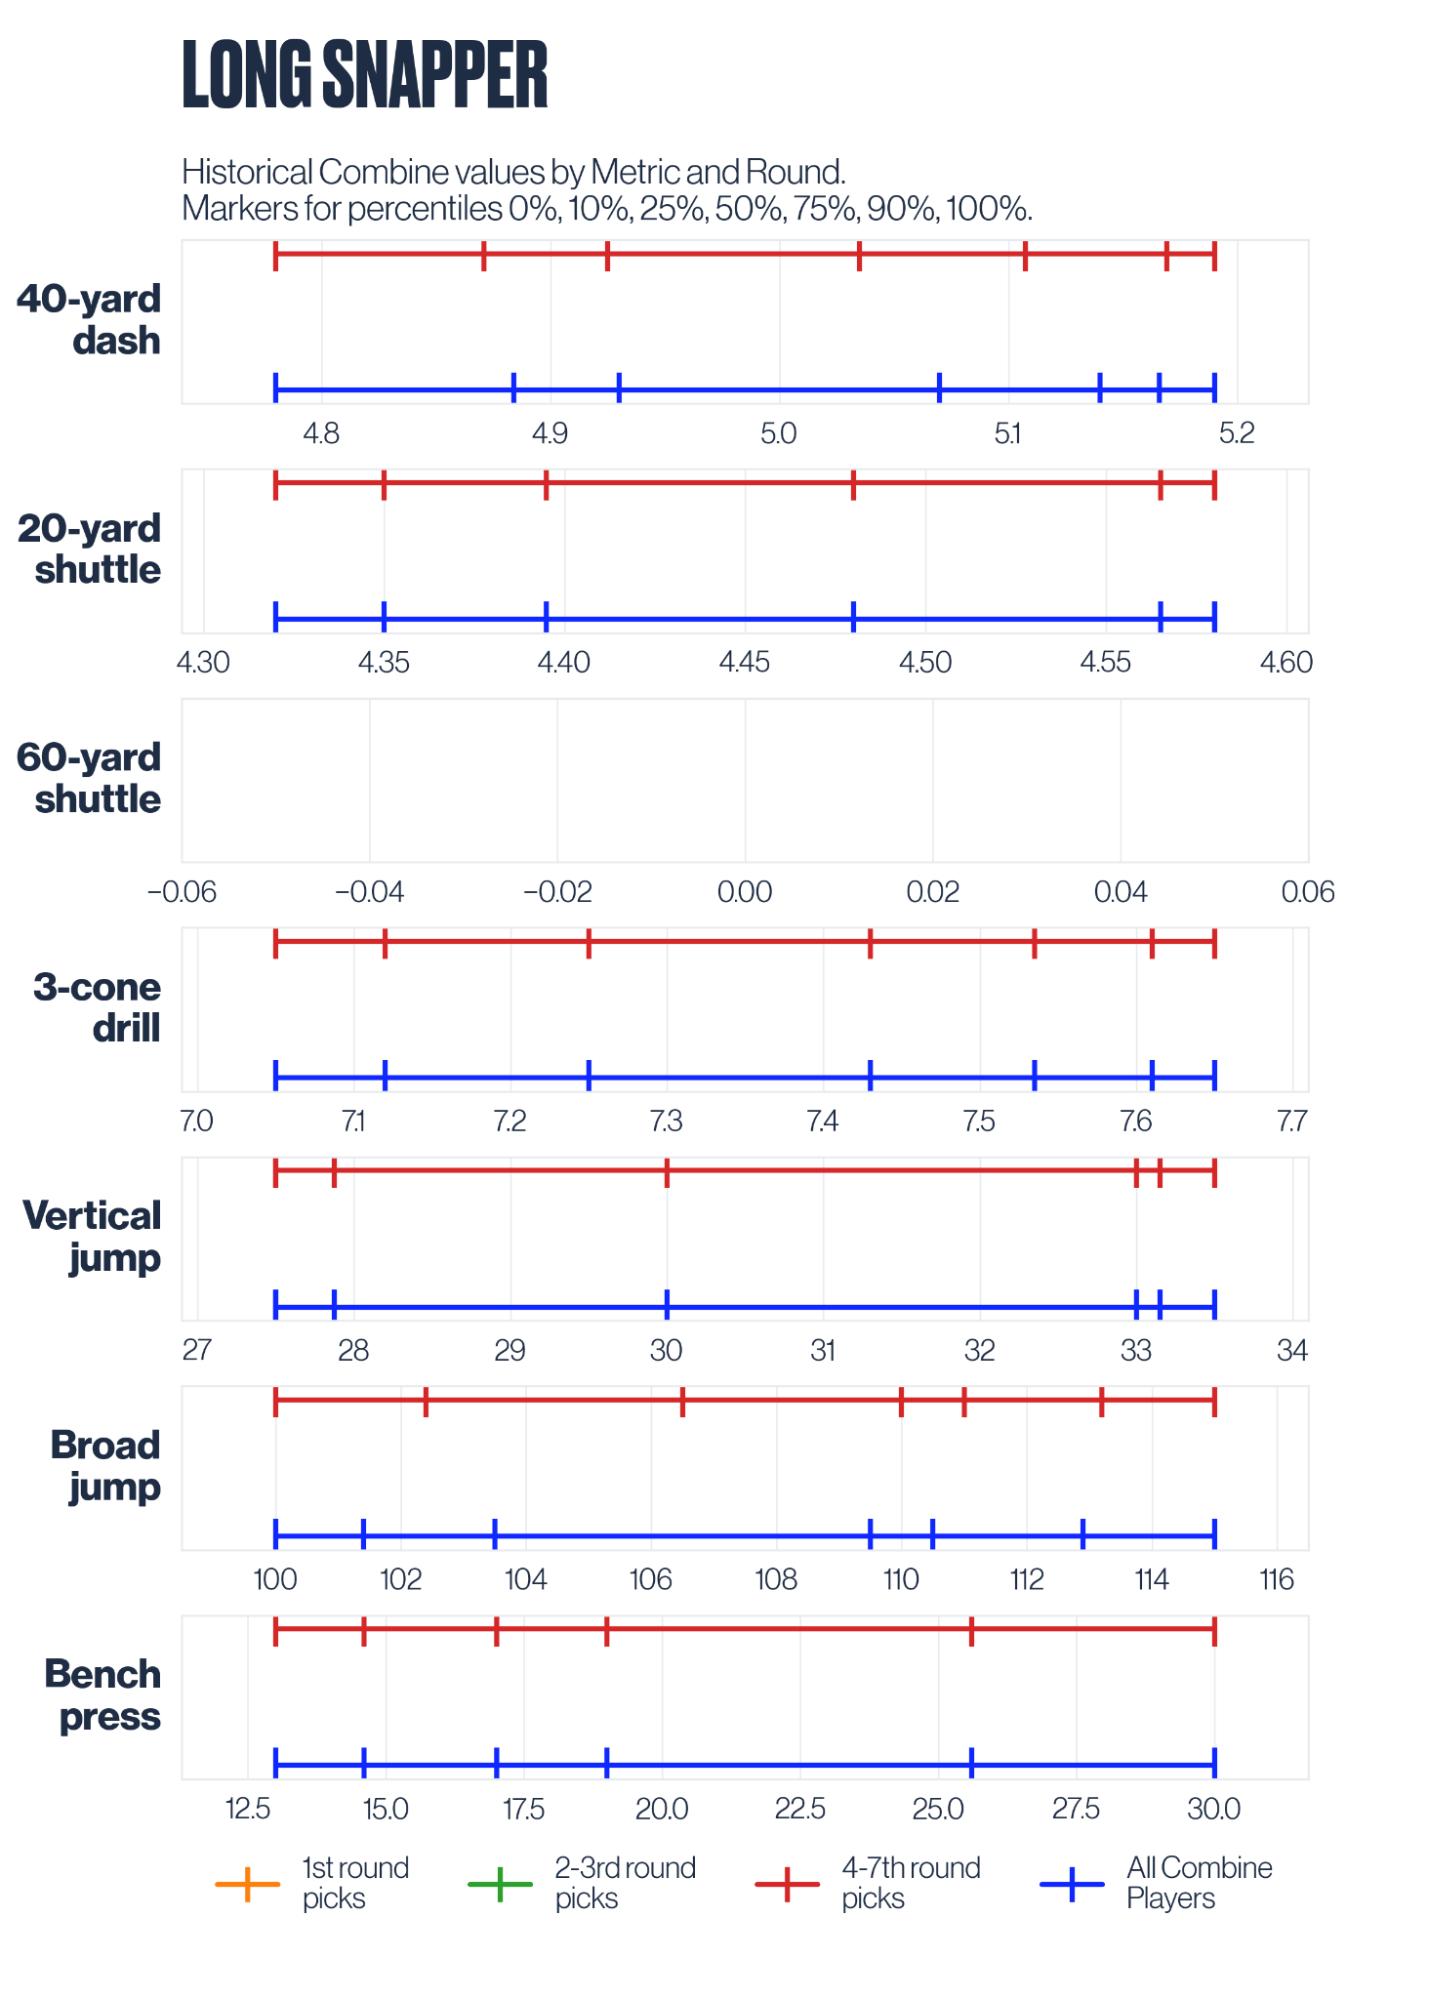
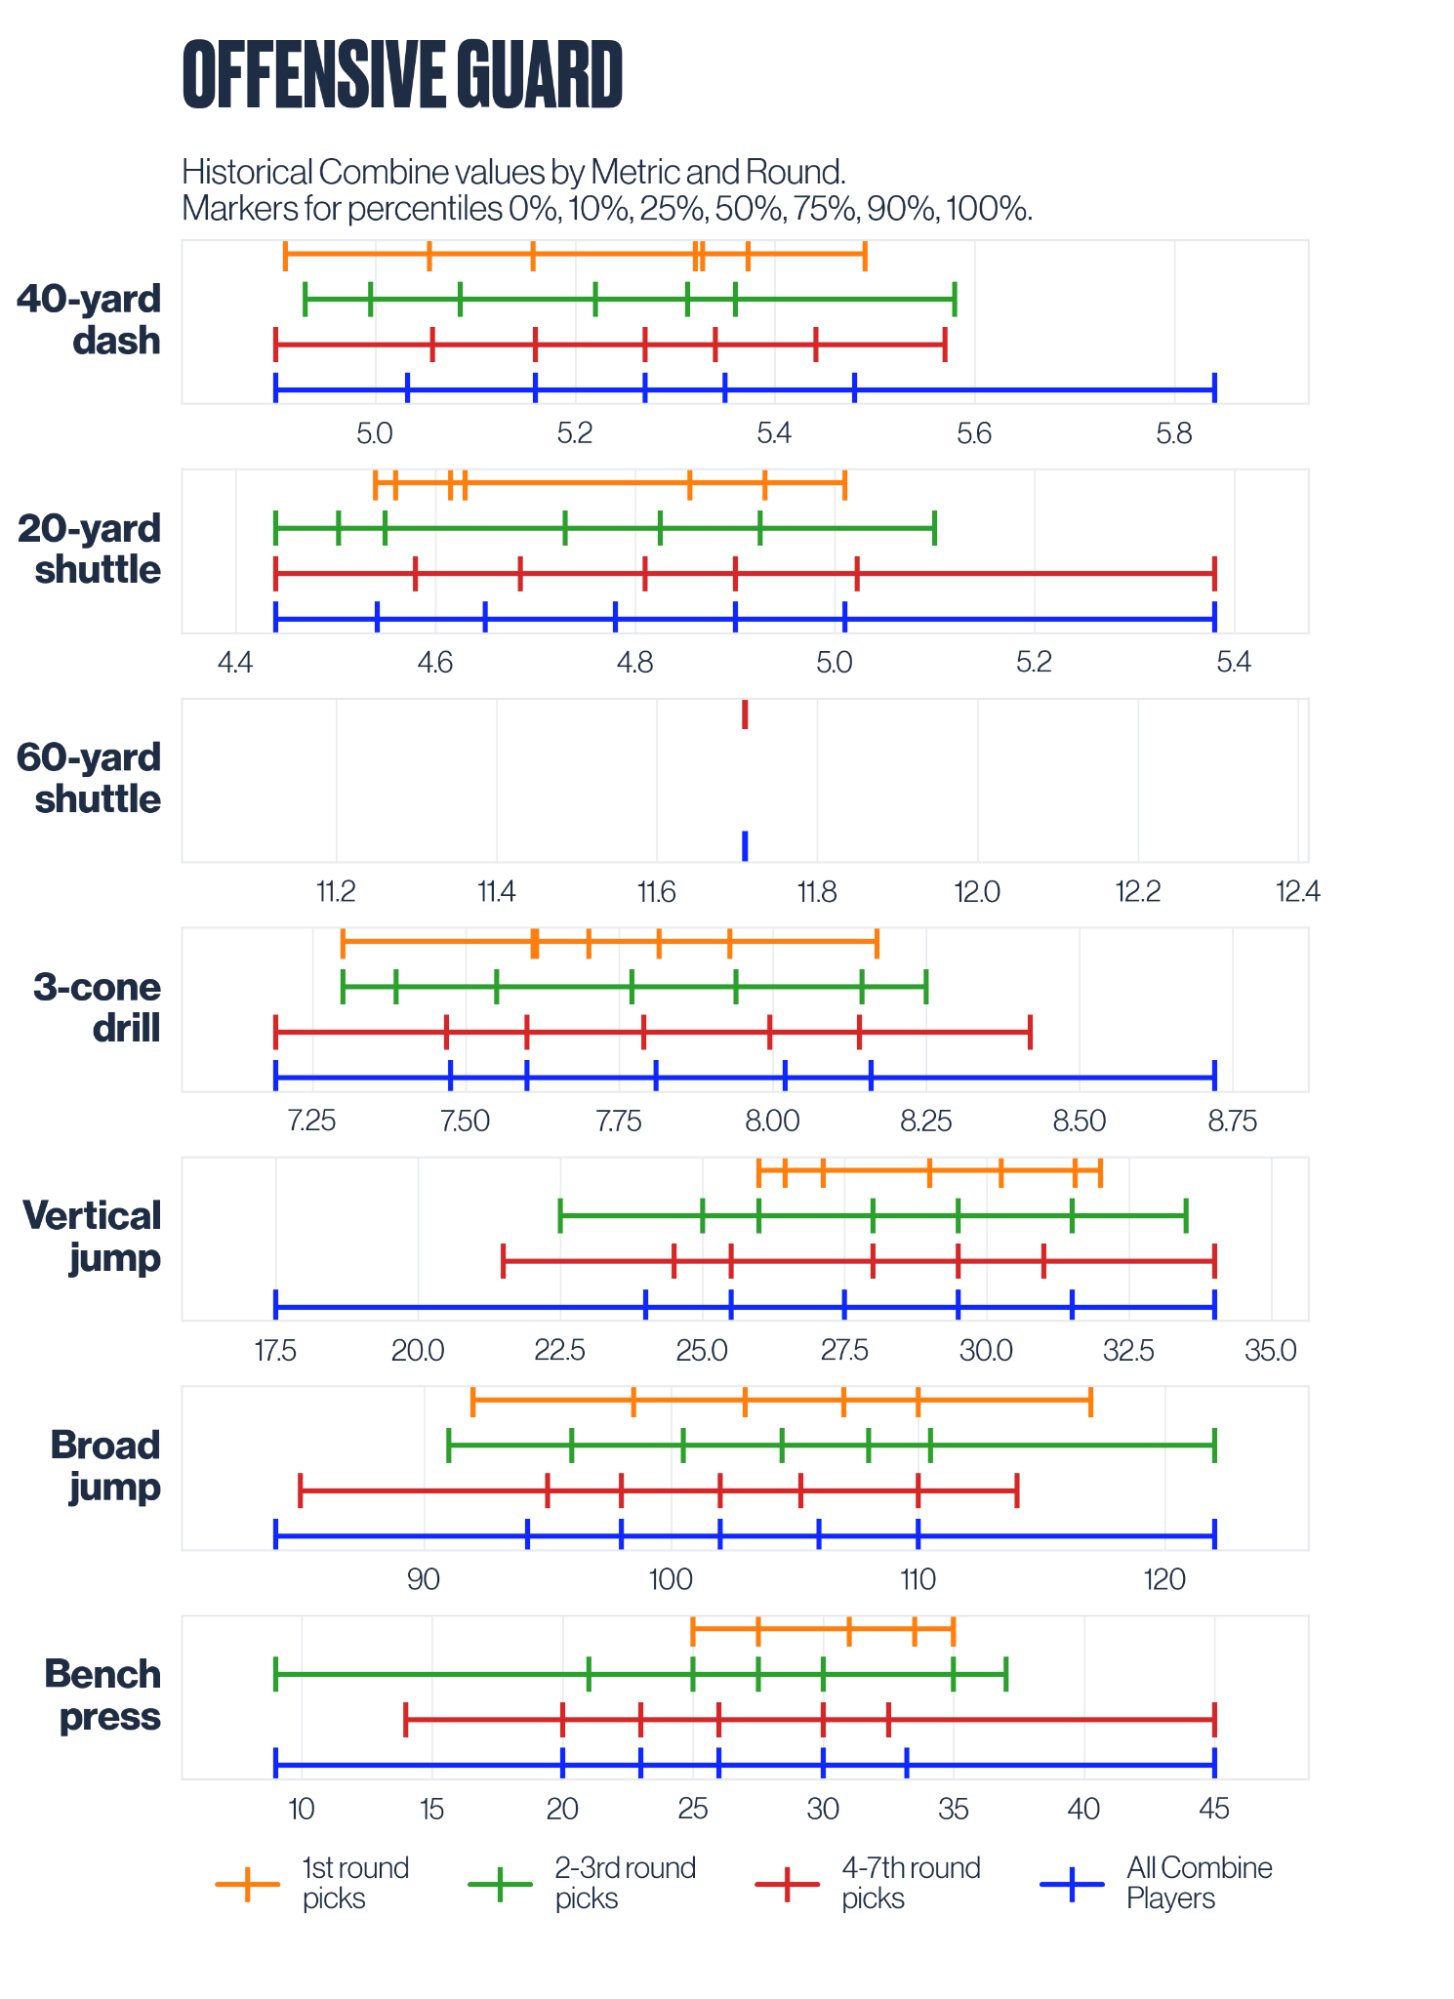
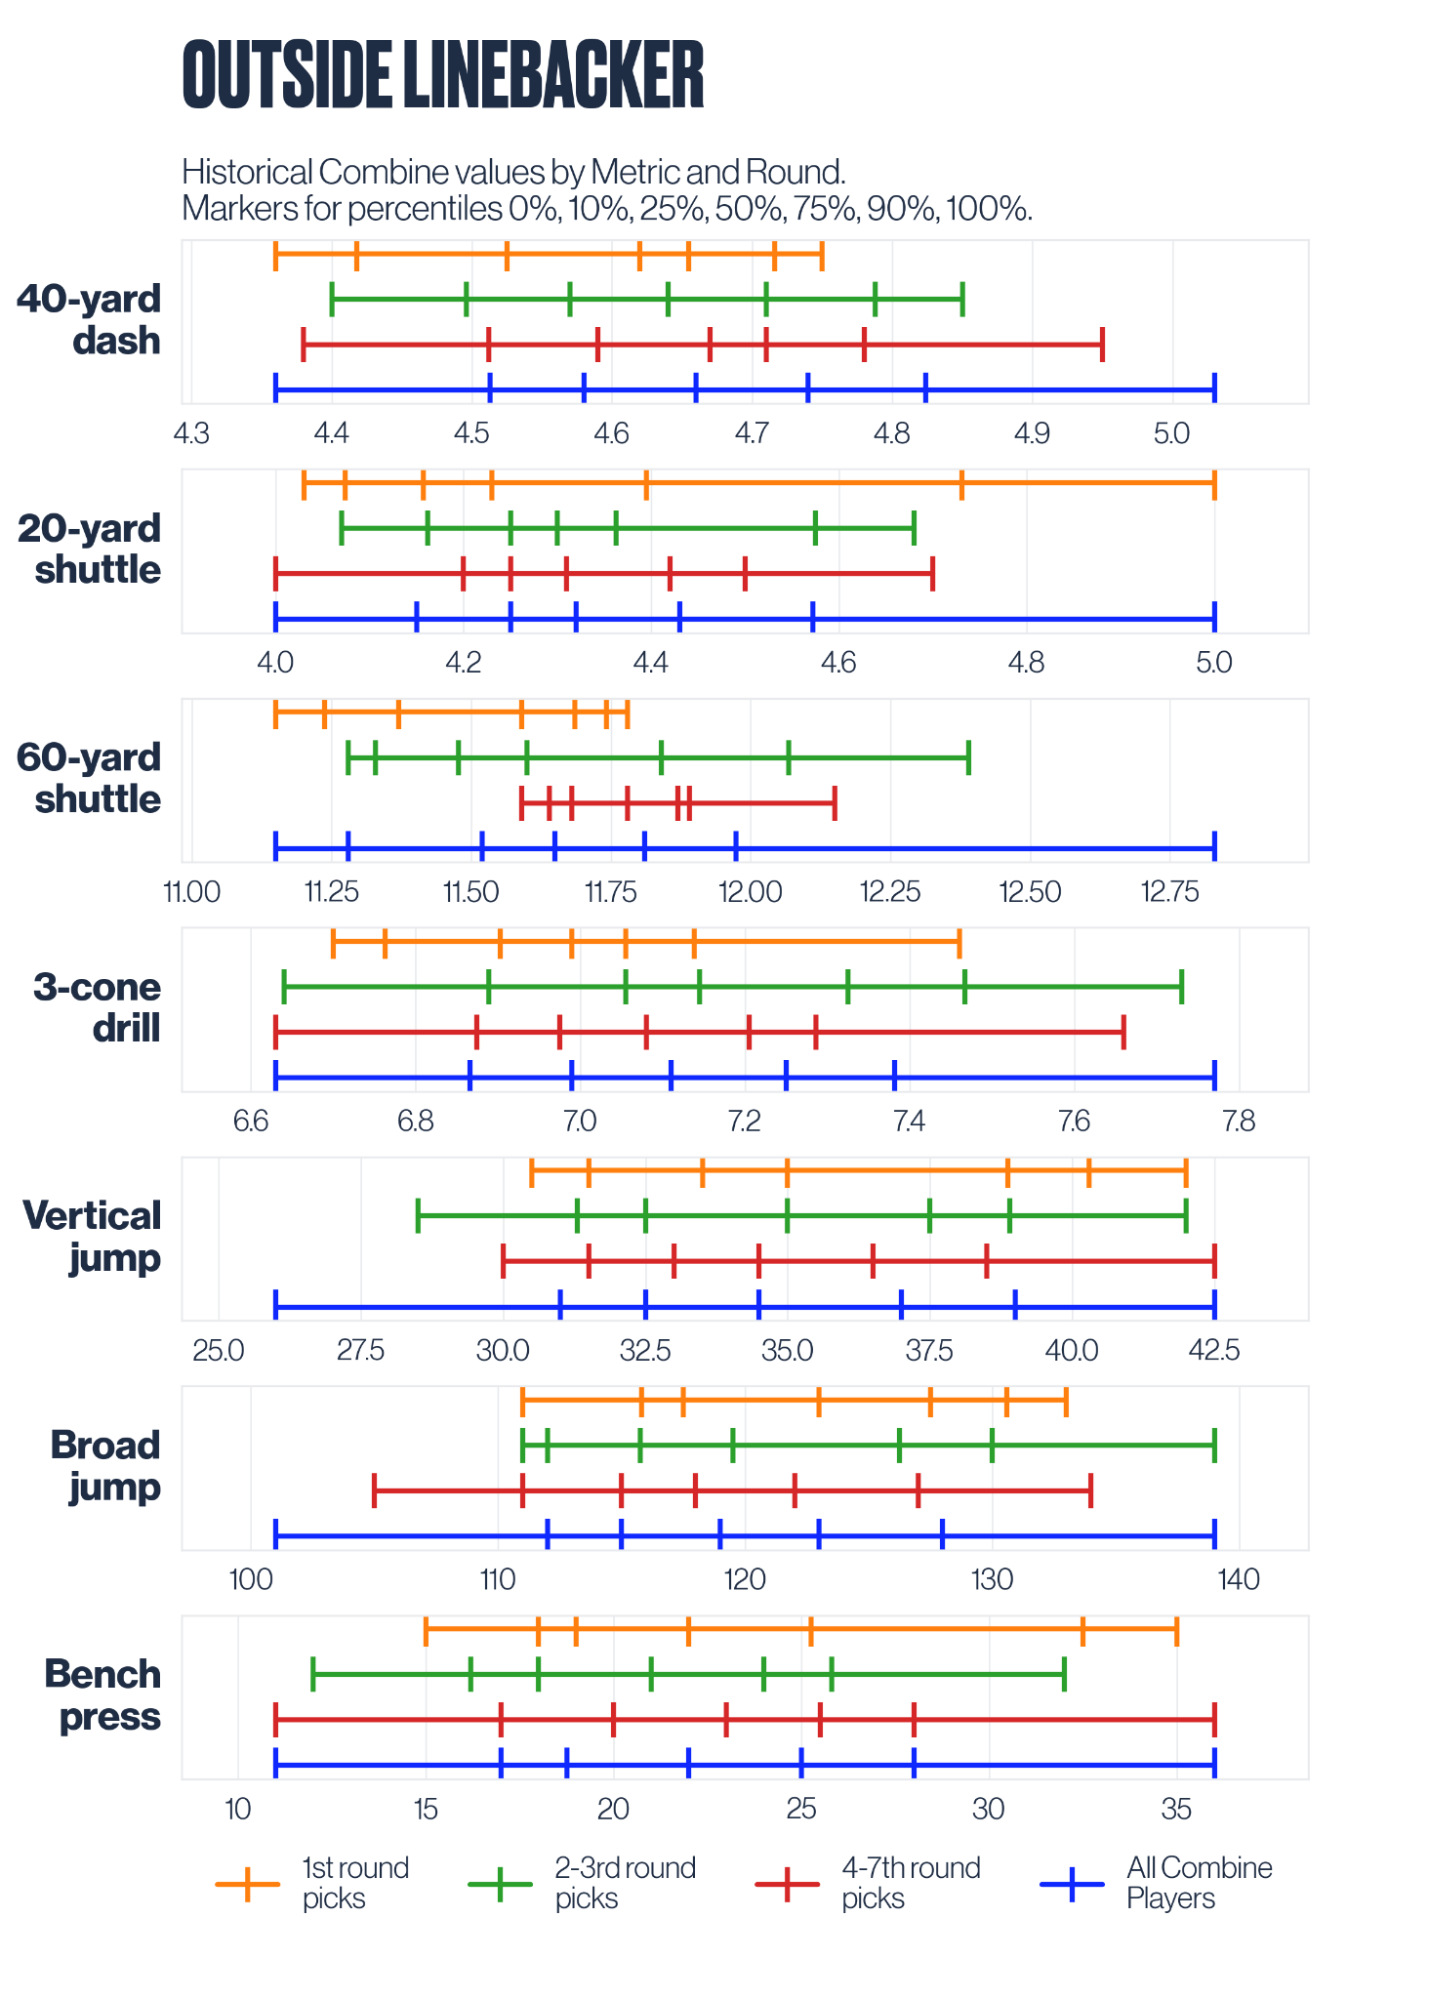
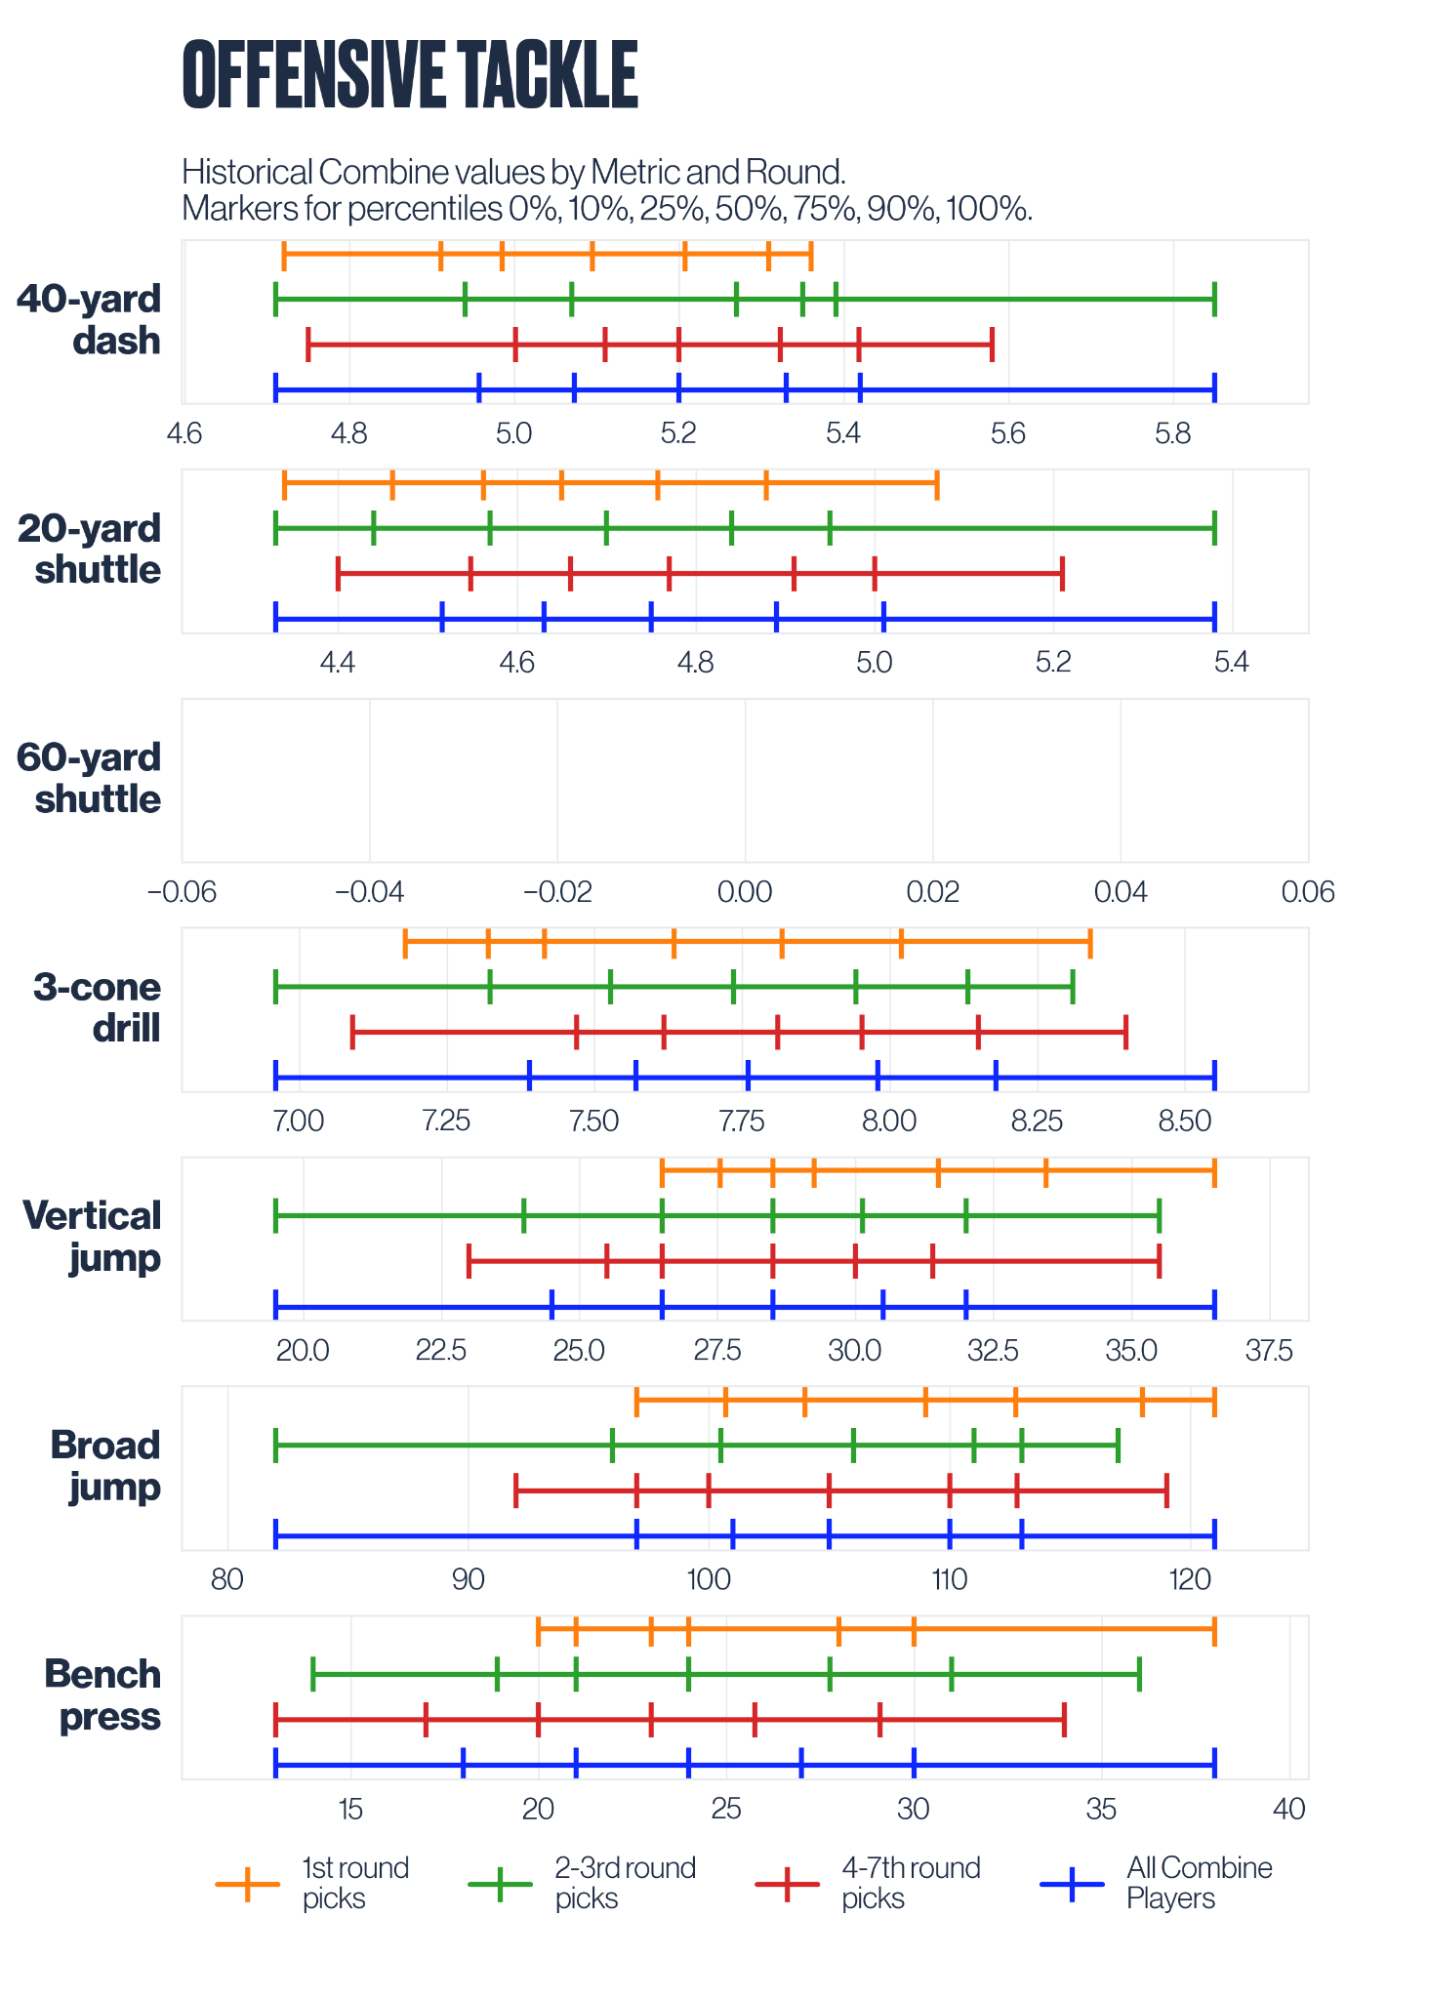
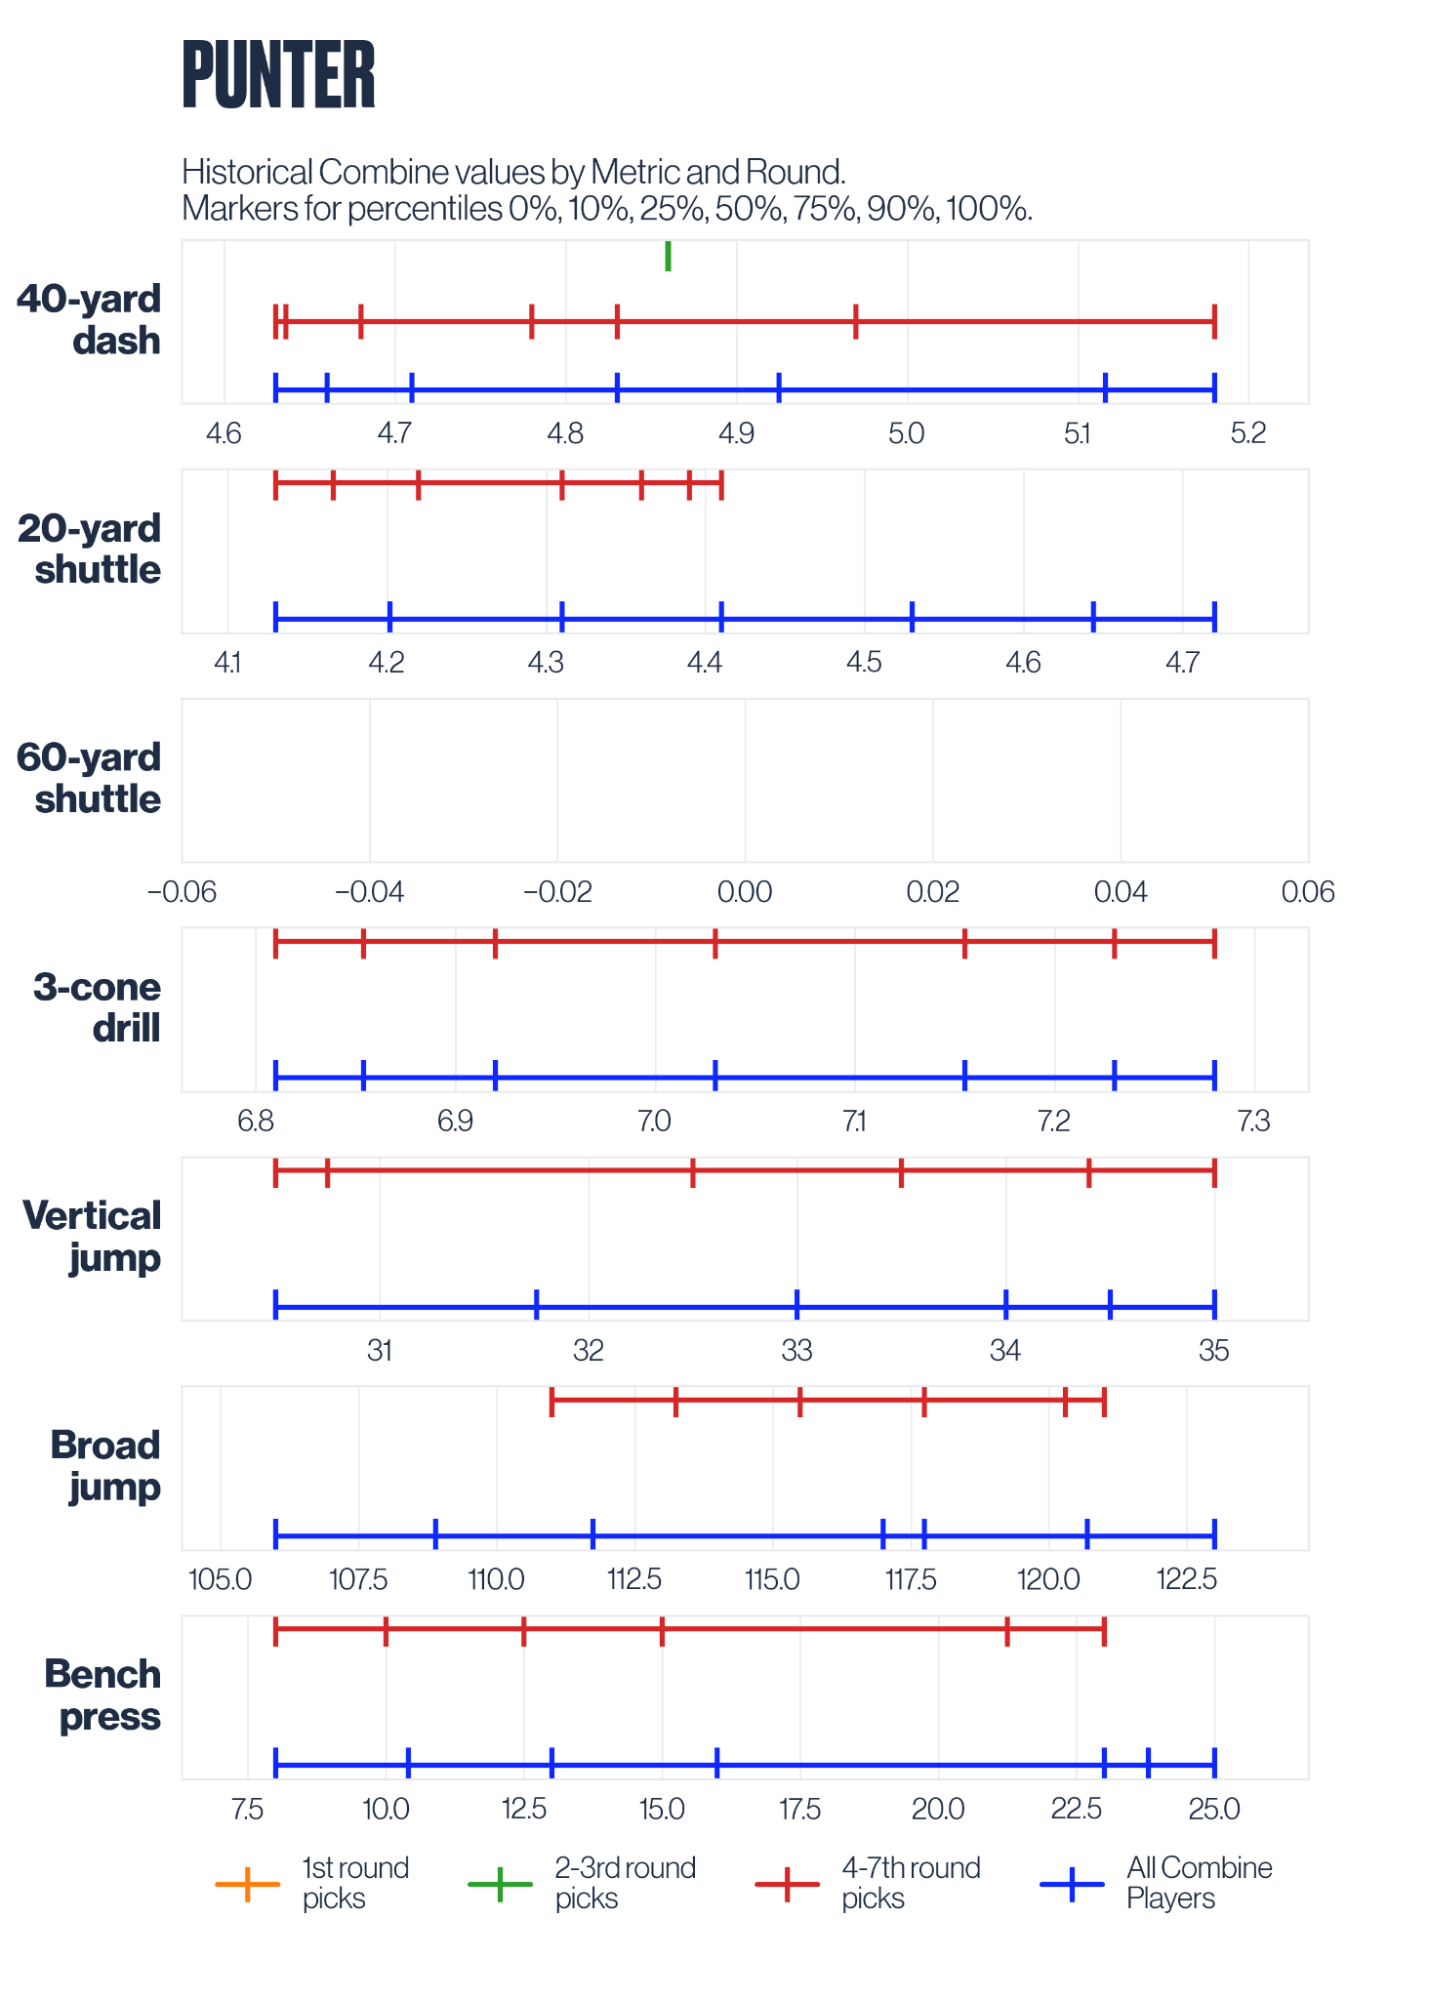
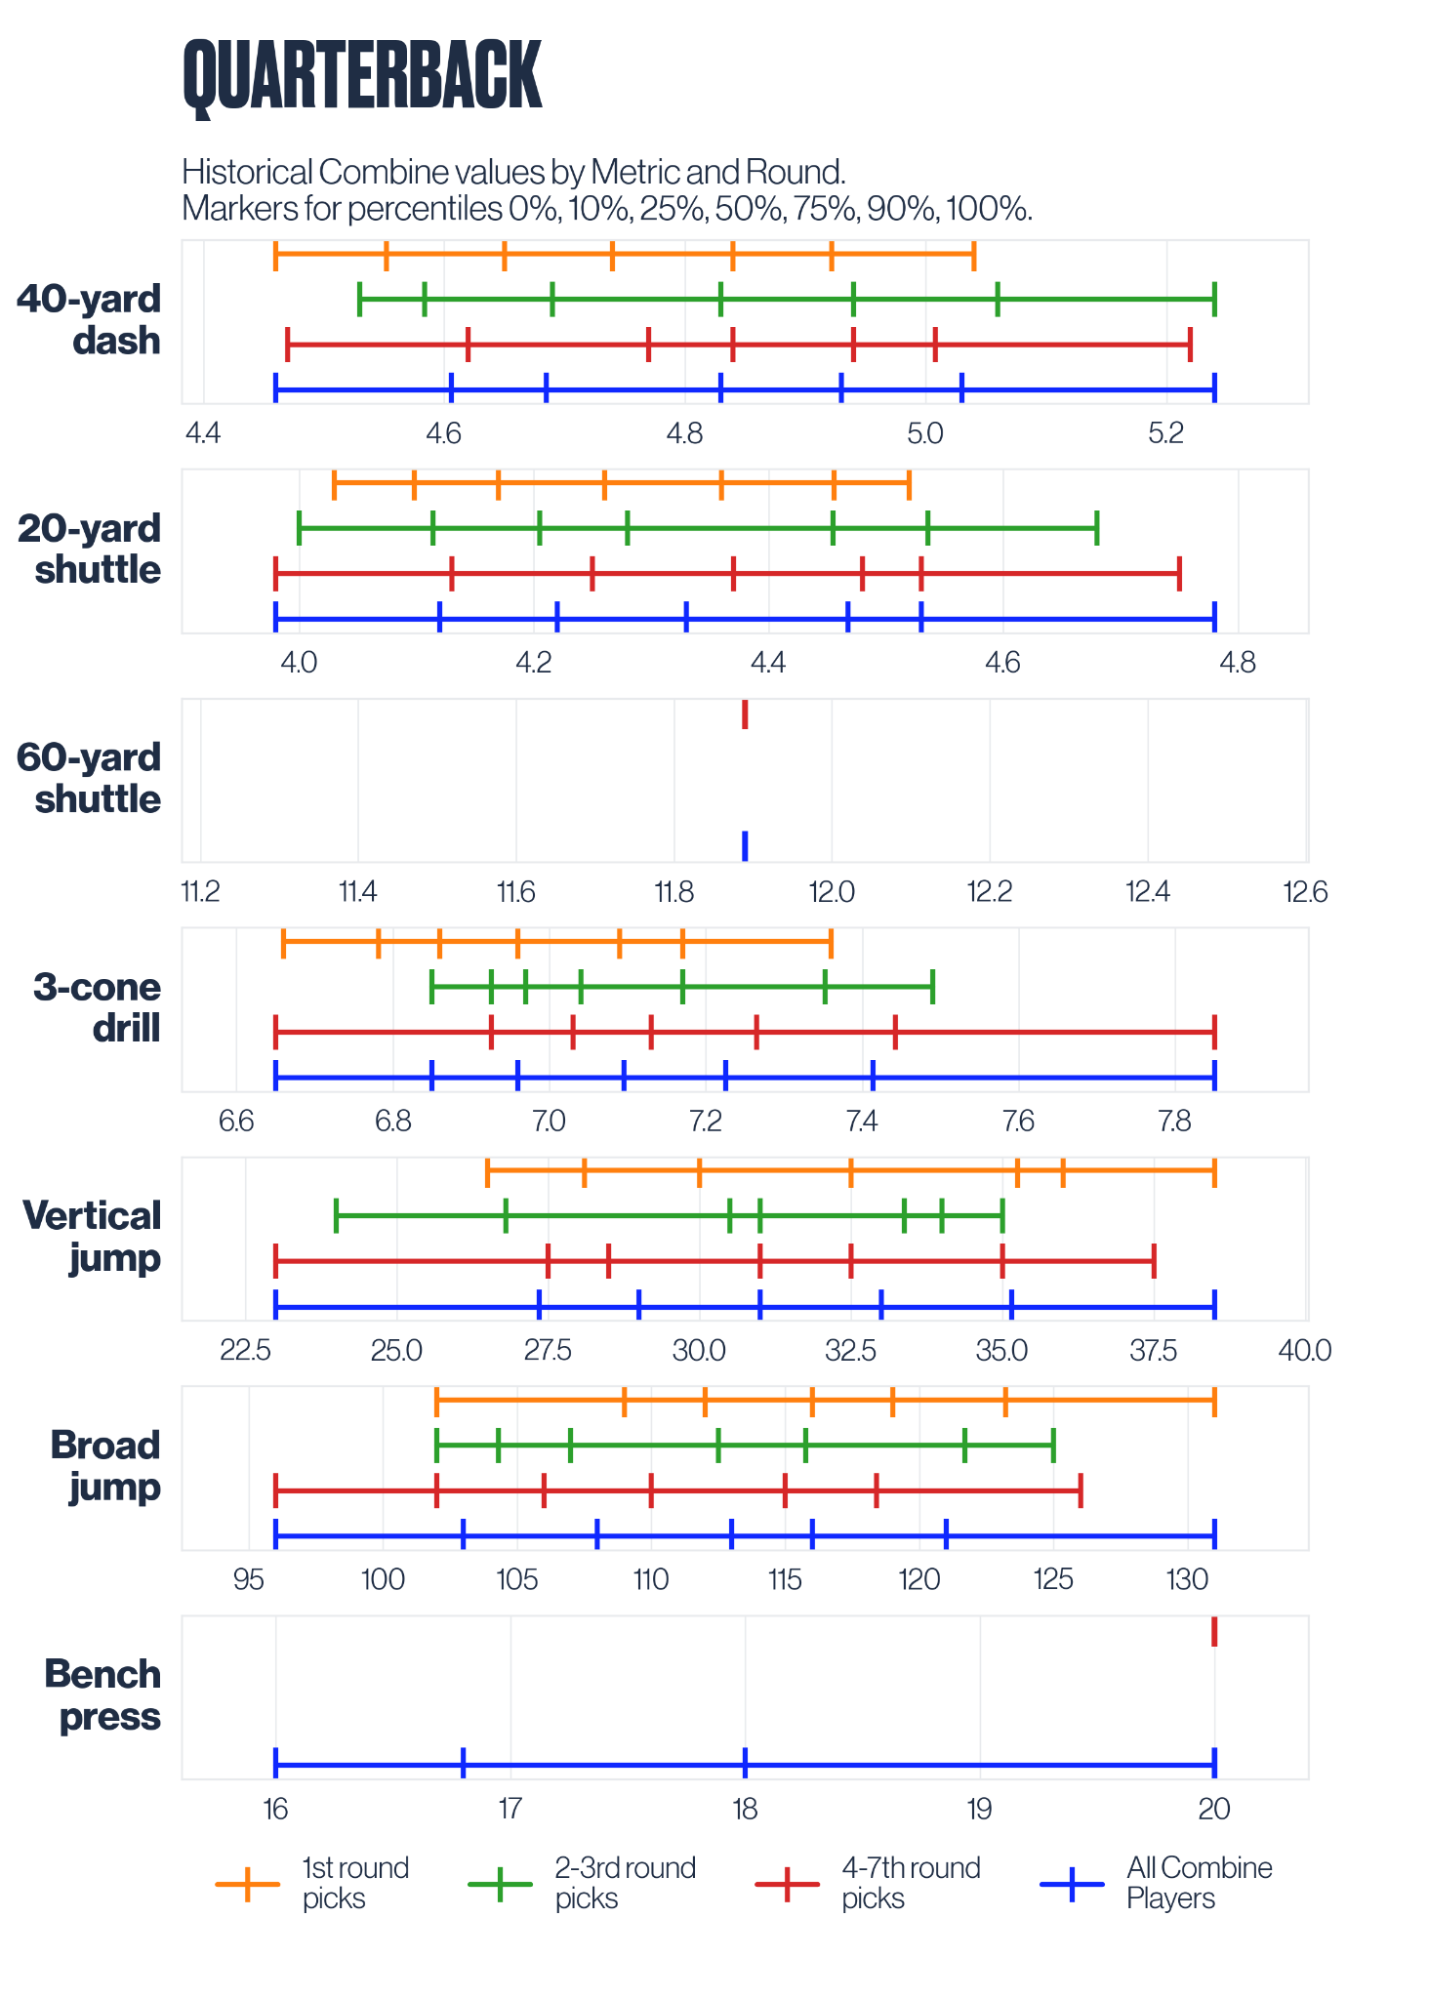
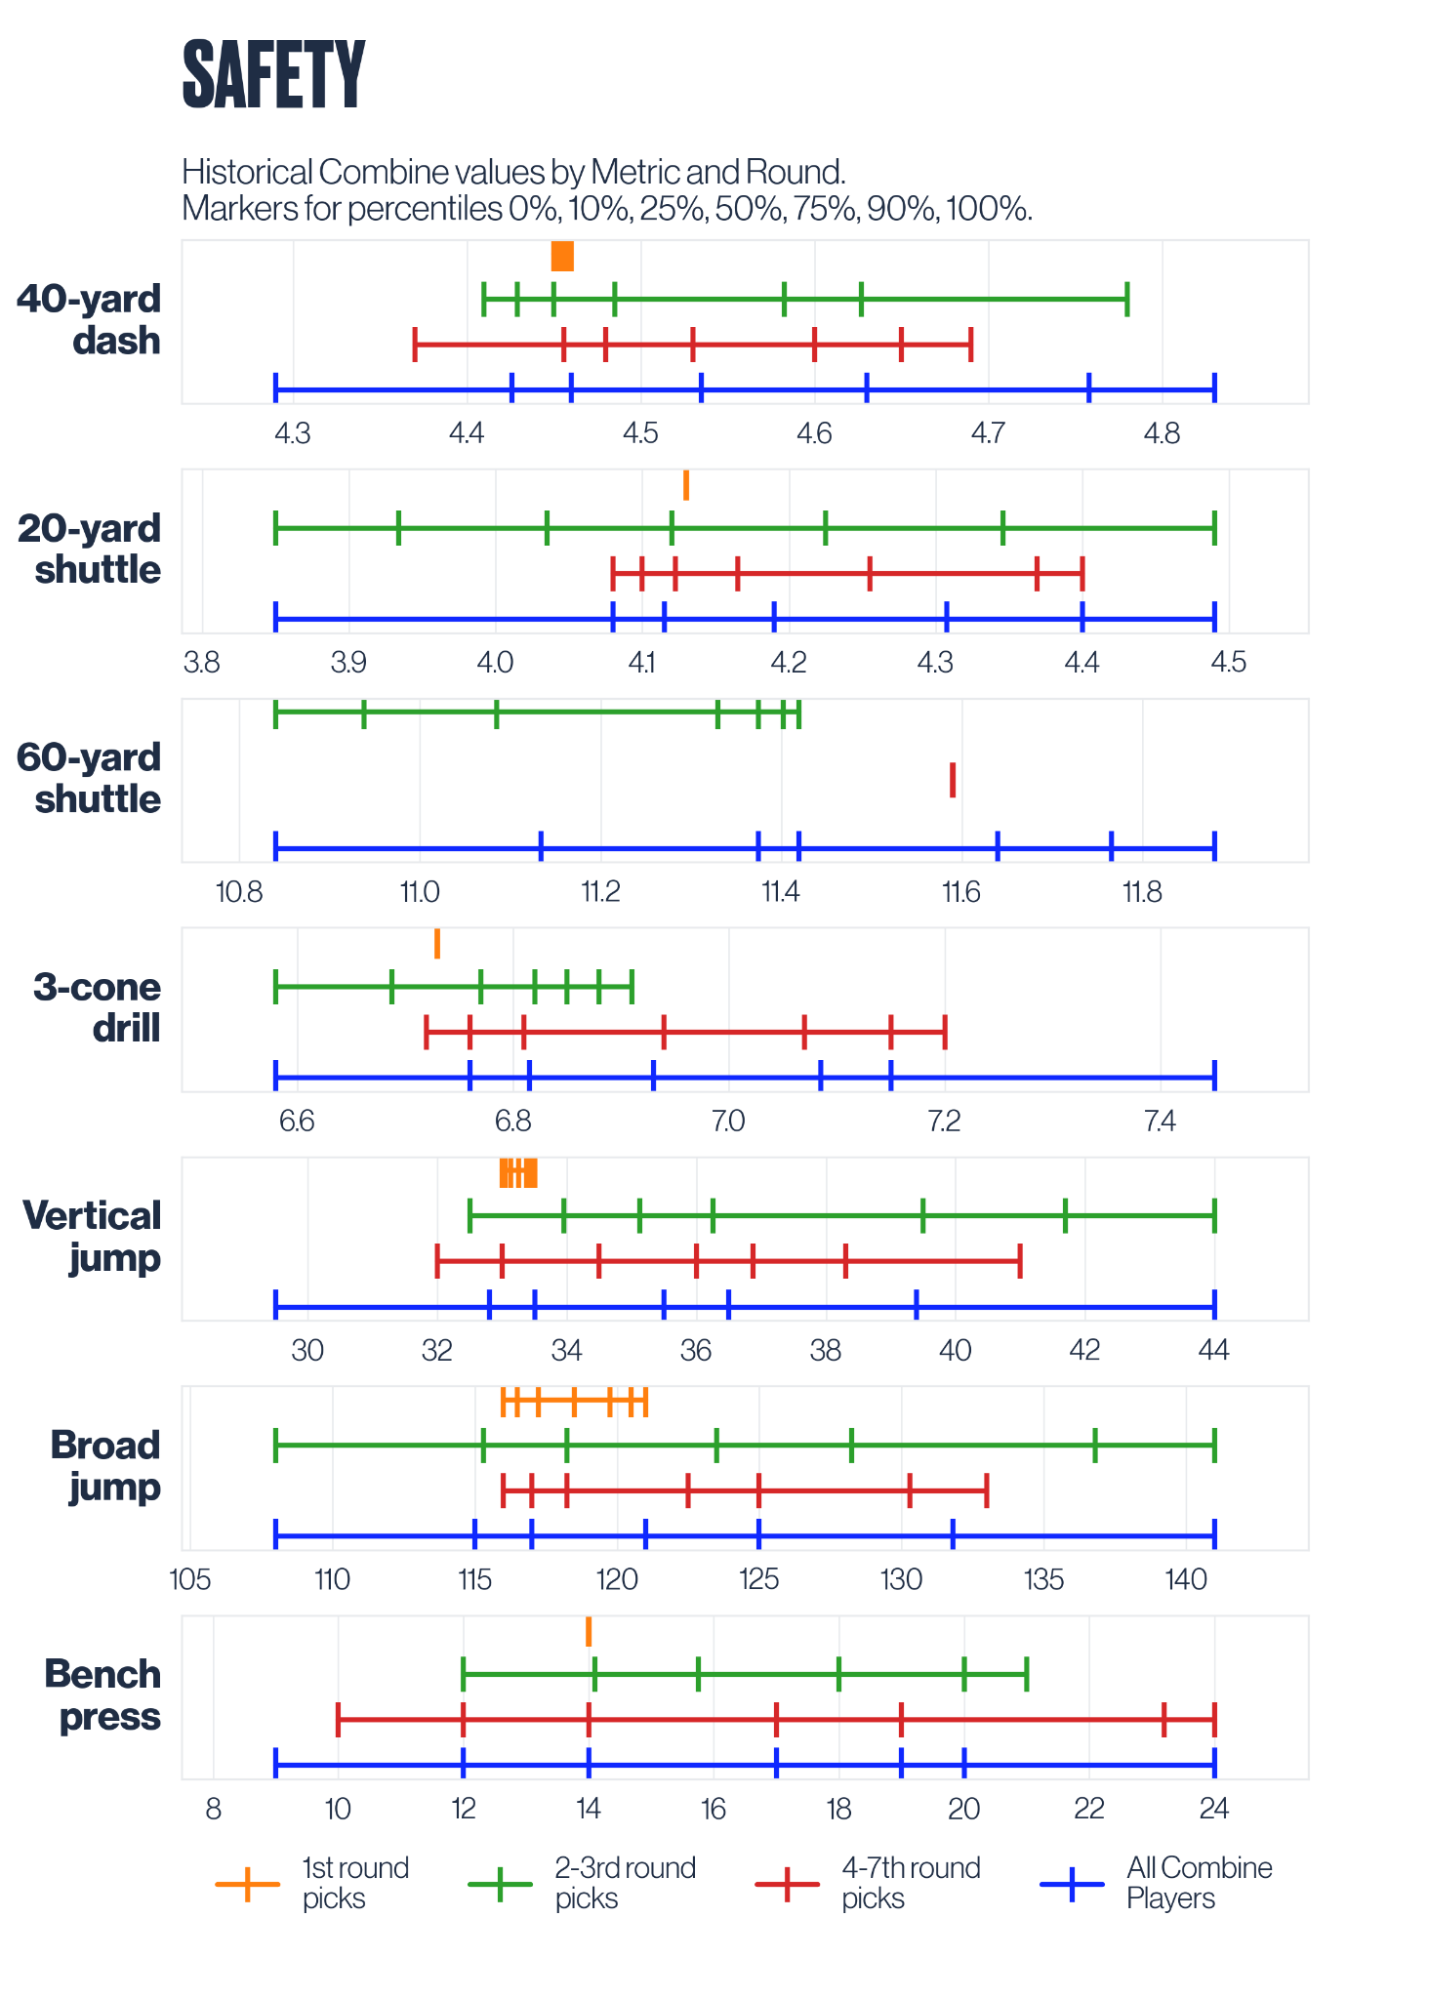
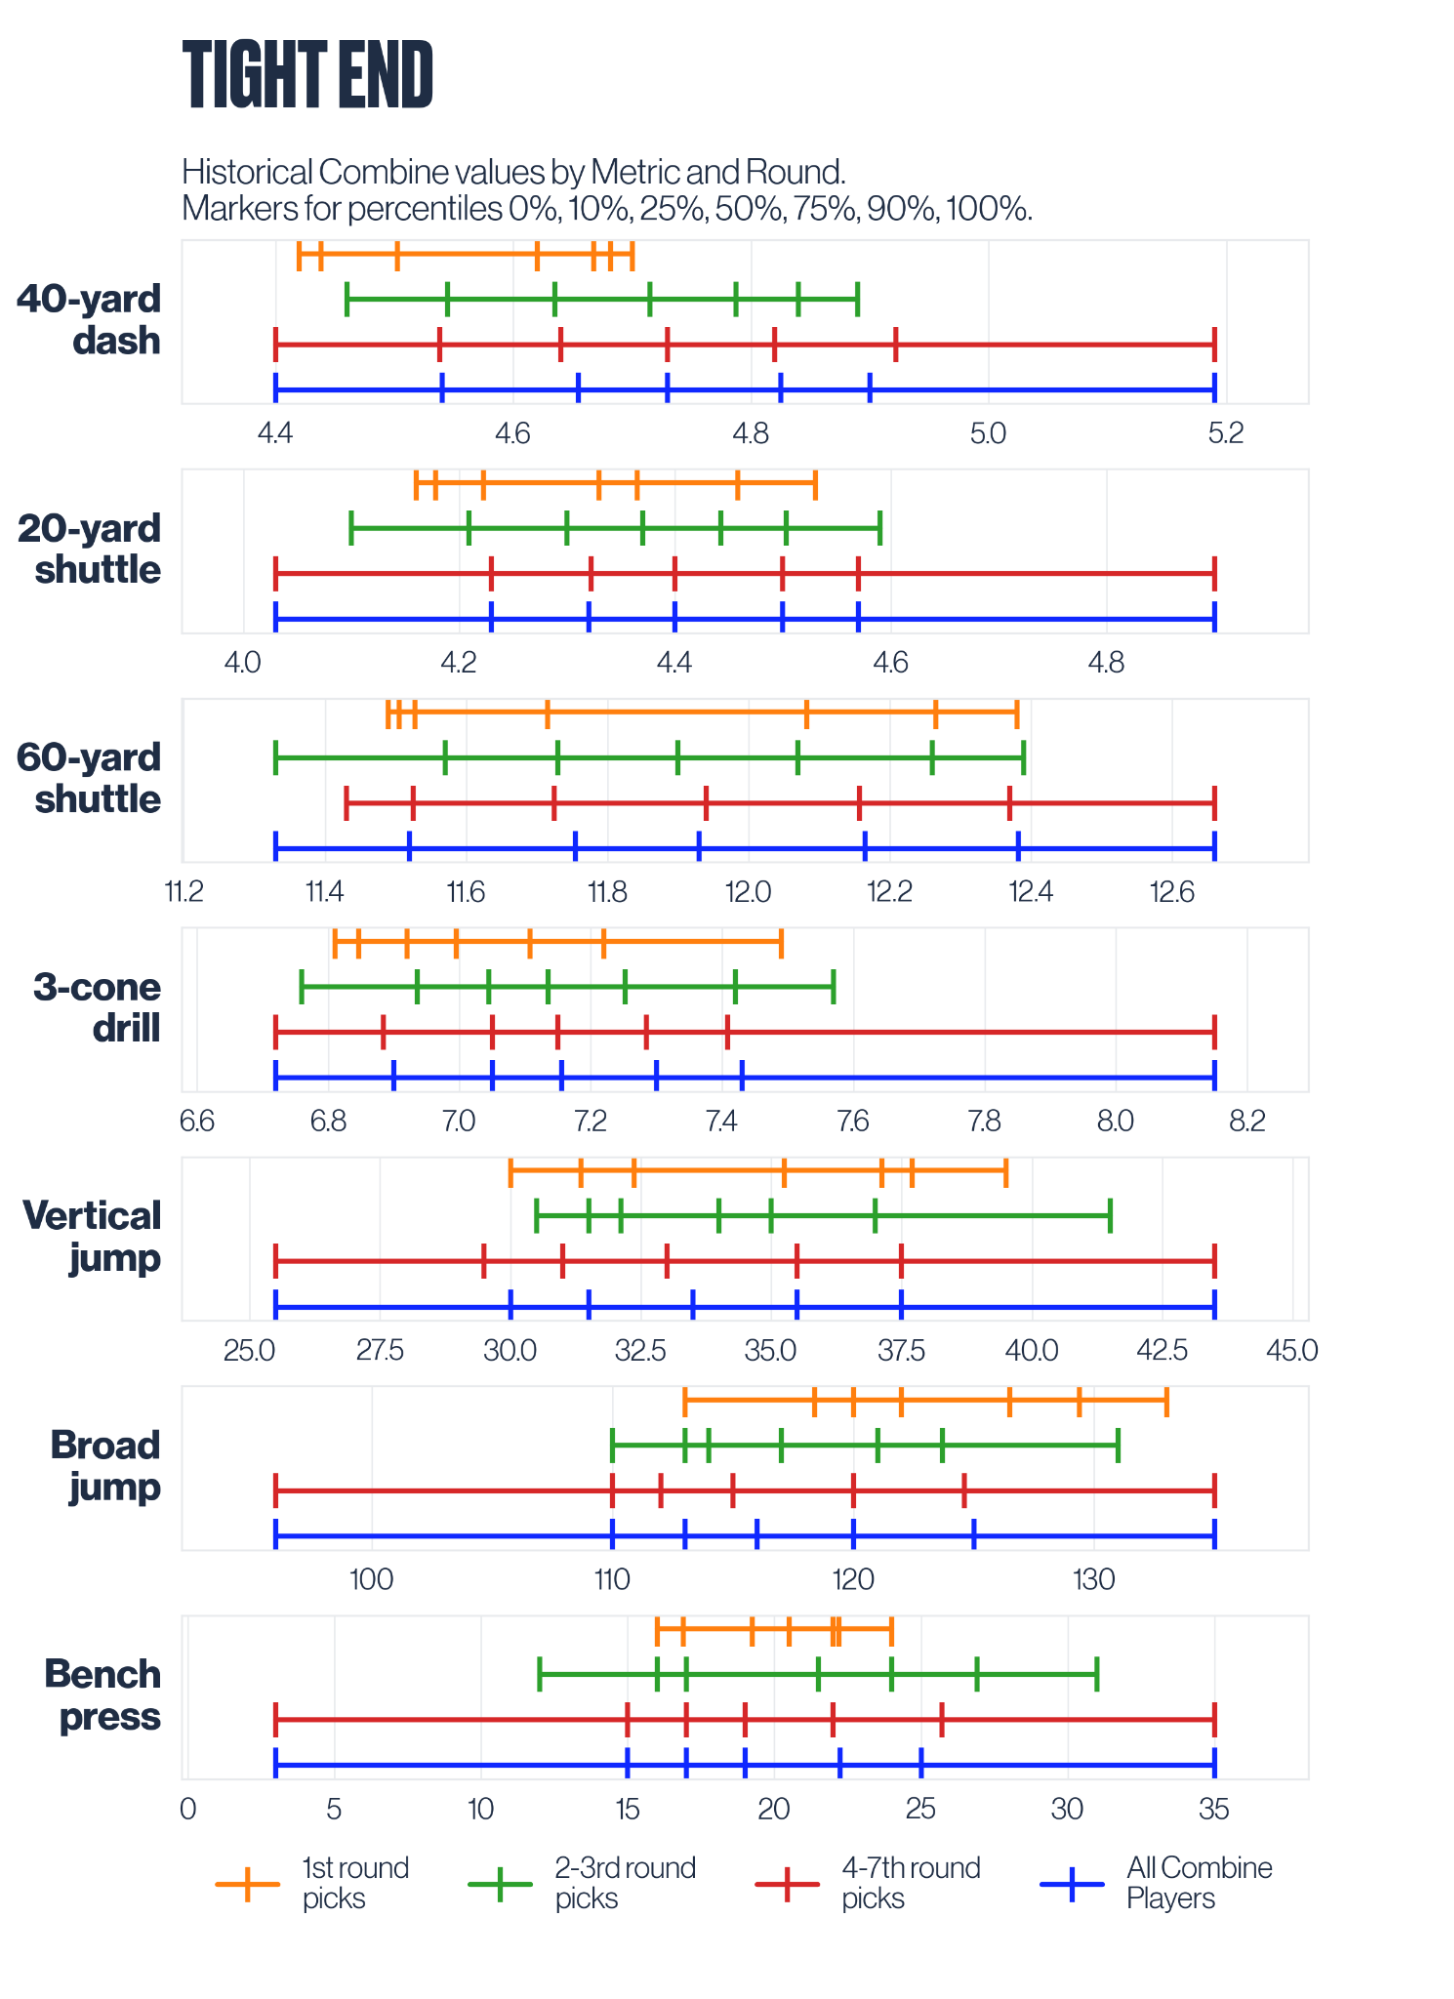
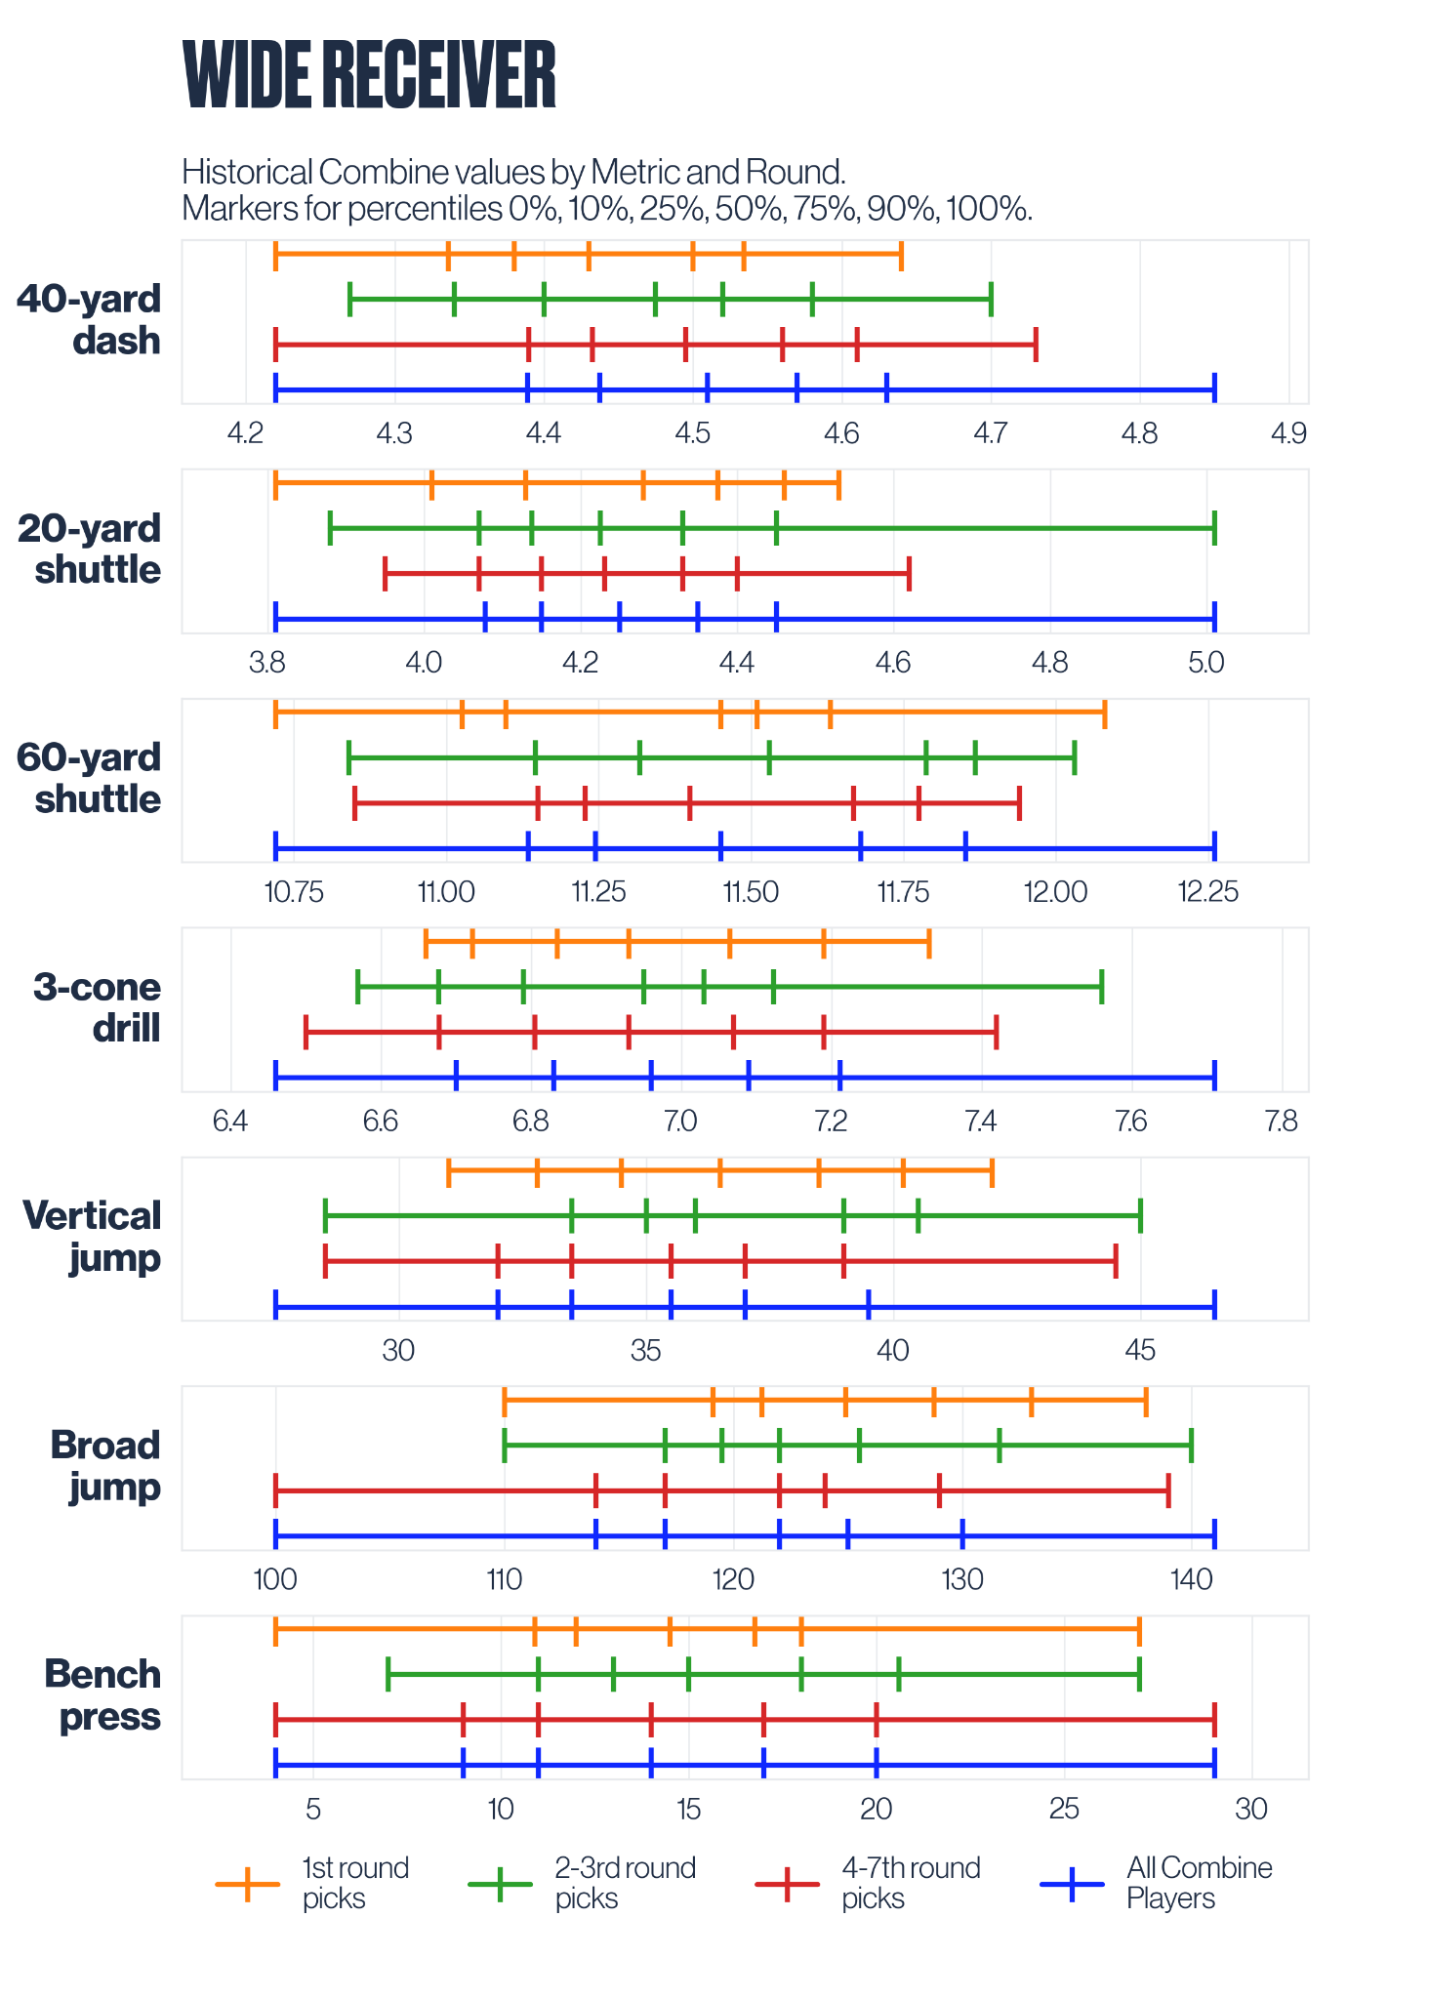
Each graphic shows a plot per position summarizing the performance by participant athletes between 2010 and 2021 in the following NFL Combine tests:
- 40-yard dash
- 20-yard shuttle
- 60-yard shuttle
- 3-cone drill
- Vertical Jump
- Broad Jump
- Bench Press
It offers an overview of all players, as well as the range of values for players that were drafted in the first round of the draft (day 1), 2 & 3 rounds (day 2) and 3-7th rounds (day 3).
How to Read the Plots
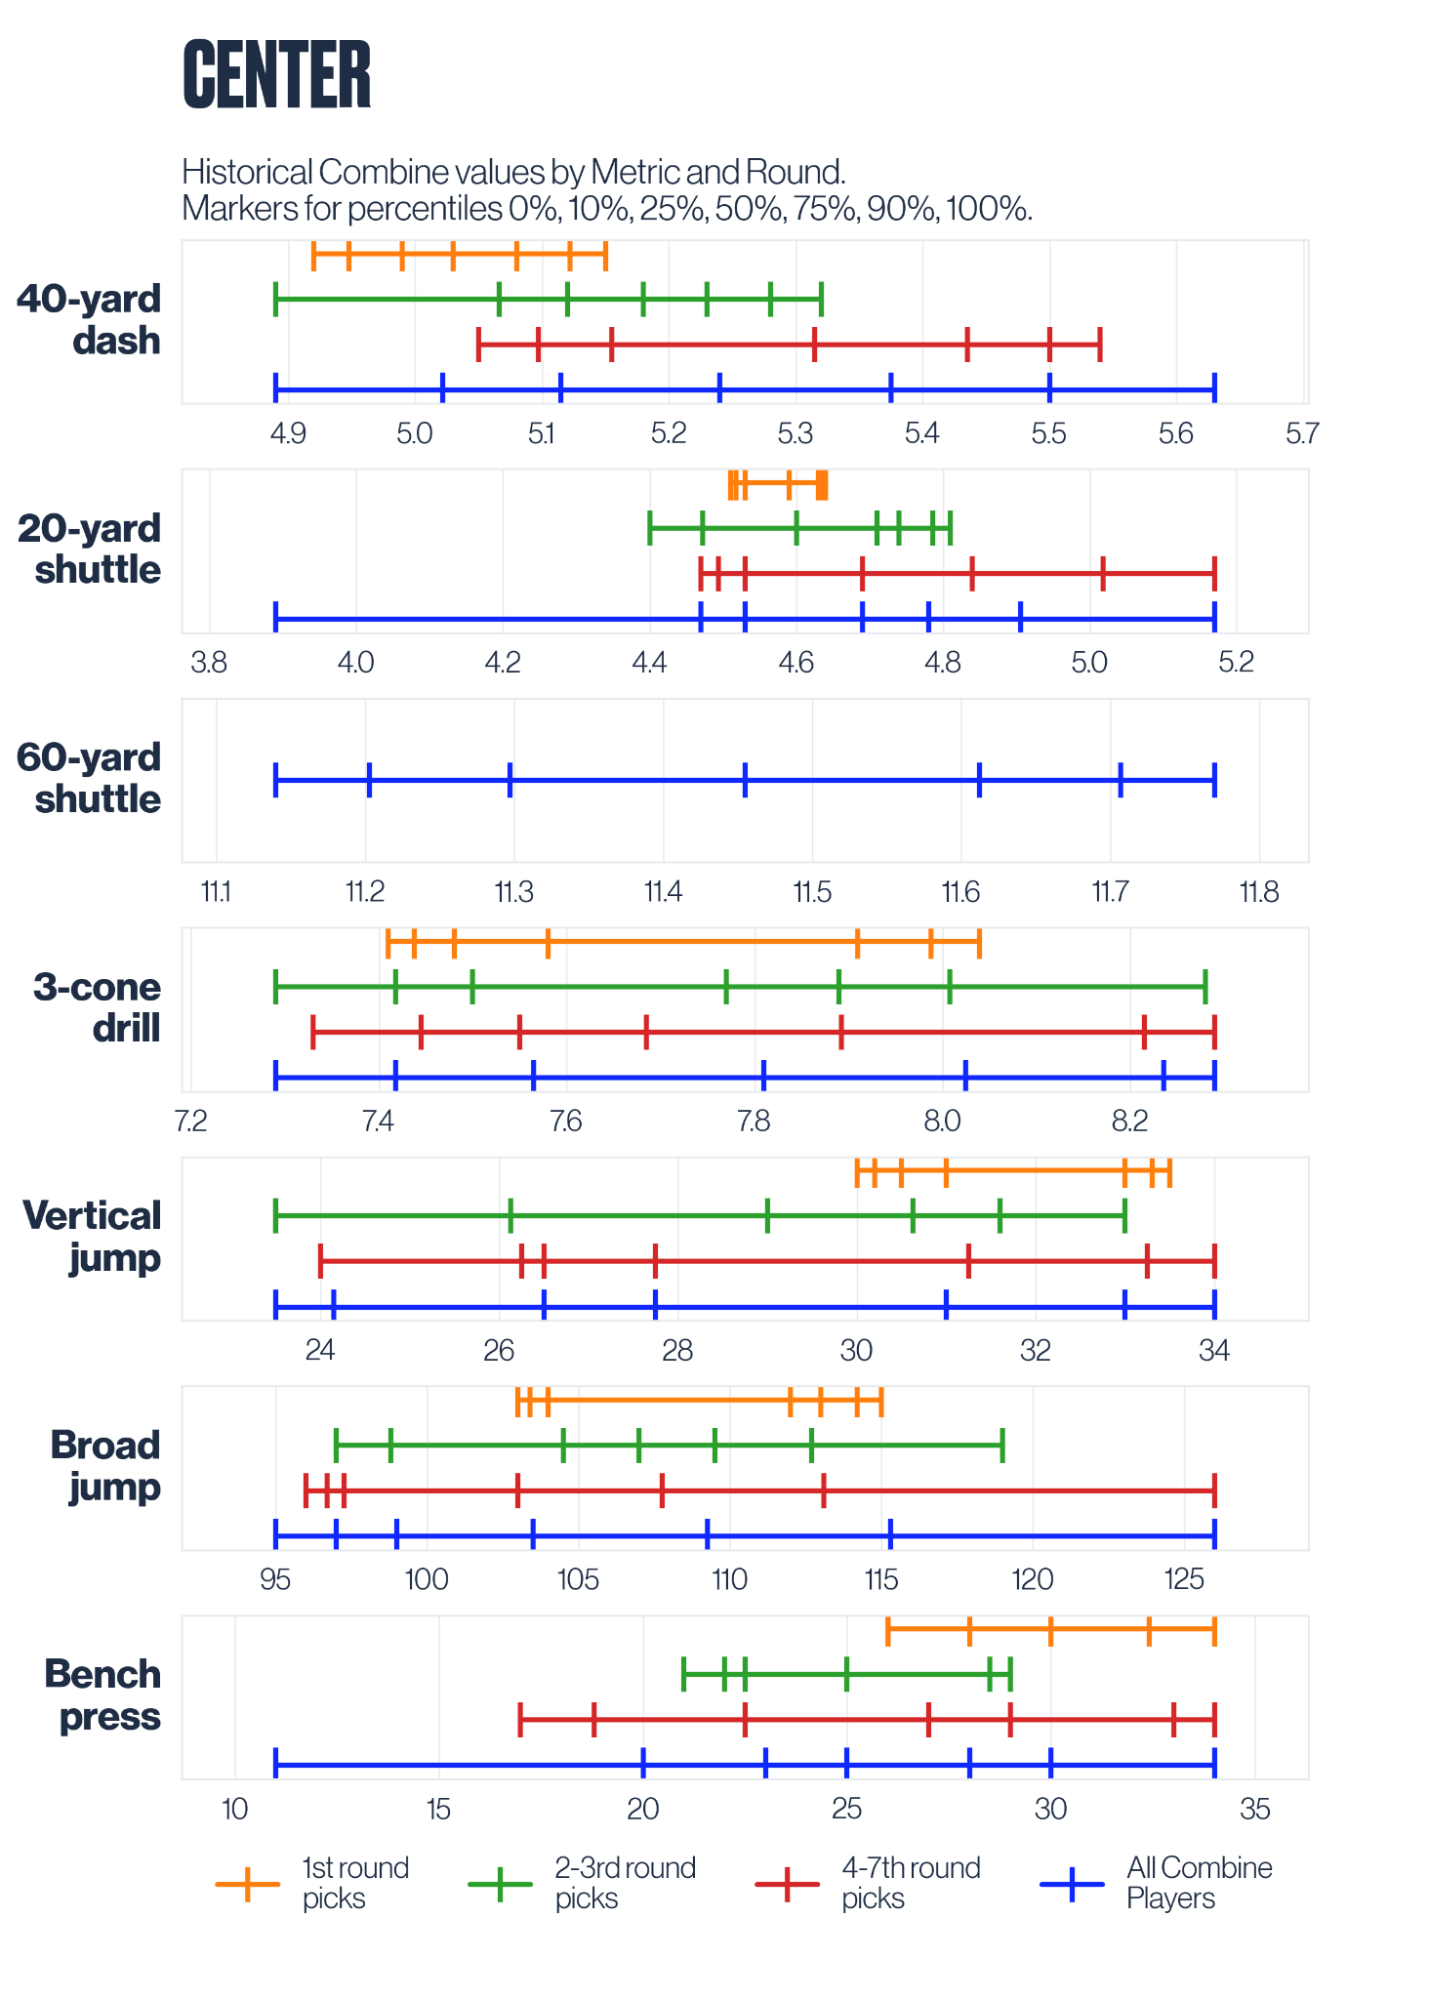
Each player plot is composed of 7 subplots, one per testing metric. The x-axis shows the range of values for each metric, and the markers on the lines represent percentiles – 10th, 25th, 50th, 75th, 90th, 100th. When an athlete performs a test, one can identify between each percentile that players fall into by mapping its test result from the x-axis into the corresponding line.
For example, say an athlete that is a Center runs the 40-yard dash in 5.3 seconds. No first-round pick in the data set ran it that slowly. When compared with second and third round picks, this athlete falls into the range of the slowest 10% (between 90th and 100th percentile). This time is more similar to 4-7 round picks, where 5.3 falls between the 50th and 75th percentiles.
Conclusion
The NFL Scouting Combine assesses multiple facets of an athlete’s suitability for the NFL. Above, we identified historical norms for first, second, and third round draft picks across just one of these facets – physical performance. These norms can be used to quickly assess the Combine performance of every position group in the upcoming NFL Draft. No single test will by itself distinguish players that will be successful in the draft process, but overall it is evident that first round picks tend to be fitter, stronger, and faster than those picked later. Which players will increase their draft stock at this year’s NFL Scouting Combine and establish themselves in the physical elite? Both scouts and fans alike will be excited to find out over the coming days in Indianapolis!
At Kitman Labs we are aiming to revolutionize how sports and high performance organizations leverage data and analytics to advance human performance. Our Custom Analytics process, utilized by teams and organizations across sport, has helped answer bespoke questions around Talent Identification, Athlete Development, and the Draft Process. Interested in learning more about how Kitman Labs’ Custom Analytics can help you with these types of problems? Contact sales@kitmanlabs.com for more information.