In February 2026, NHL players returned to the Winter Olympics for the first time since the 2014 Sochi Games. They did not take part in 2018 or 2022. A mid-season break for a major tournament raises the same questions every time: what does it do to the rest of the schedule, and what does it ask of players who are already heavily used.
Fans were eager to see them back. The United States–Canada gold medal game reached a peak of 26 million US viewers in overtime. Some of the NHL’s busiest players were competing in high-pressure games, with about a third of the NHL season still to play.
That raised a simple question: Does playing in a major tournament in the middle of the NHL season hurt teams? If it does, the impact should have been on display in the rest of the 2025–26 season.
At Kitman Labs, we examined the question from two angles. First, did teams with more Olympians finish below expectations? Second, did those players see changes in their playing time or scoring after returning to the NHL?
What we found
- Ice time fell slightly. Olympians played around 20 seconds less per game in the first 10 team games back, relative to comparable non-Olympians.
- Scoring rate held. We found no clear evidence of a change in points per 60 minutes on the ice.
- Team results showed no link. Having more Olympians on the roster did not predict finishing below expectations.
No clear effect is still an answer. One concern about a mid-season tournament is that it costs teams something across the rest of the season. We found no clear sign of that in team results.
Playing less is not the same as producing less while on the ice. That distinction runs through the rest of this analysis.
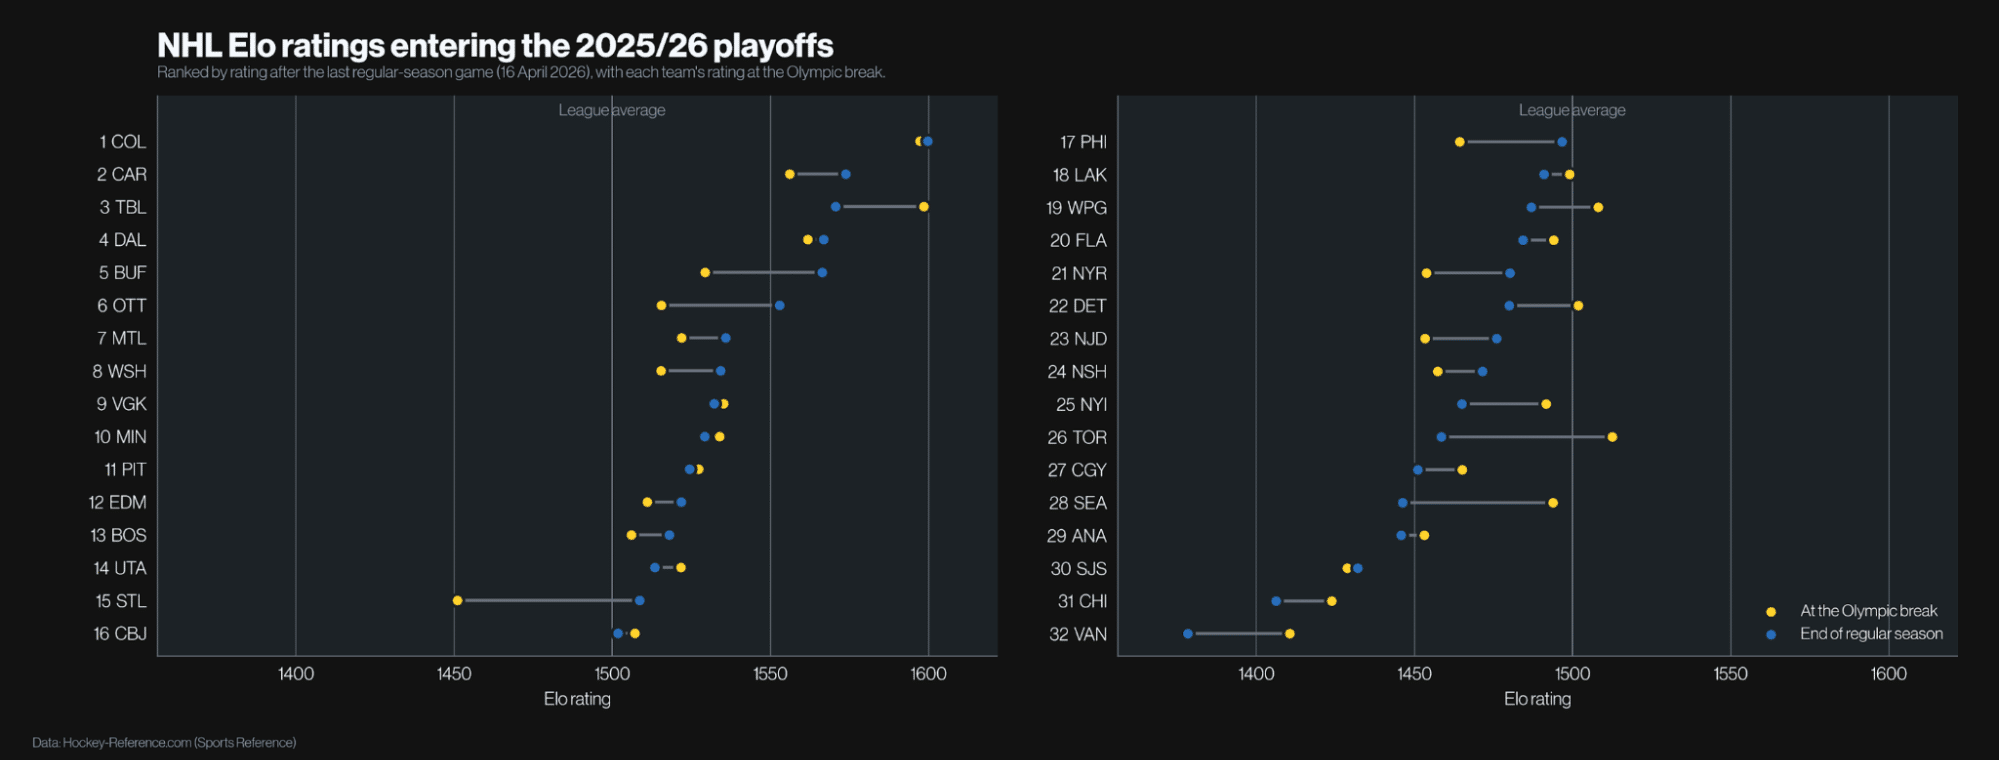
Each team’s Elo rating at the Olympic break and at the end of the regular season, ranked by final rating.
Did teams with more Olympians fall short?
To assess team performance, we needed something more useful than a simple comparison of results before and after the break. We used an Elo model, which rates team strength based on results, to estimate how teams might finish the season. We held each team’s rating at its pre-break level and simulated the remaining schedule 10,000 times. That gave us a forecast to compare with each team’s actual finish.
We tested the model against simpler forecasts. It beat a 50/50 prediction in every season tested. In 2025–26, its forecast of final points was off by 5.4 points per team. That compared with 6.2 points when using each team’s pre-break pace and 6.7 points when using last season’s finish.
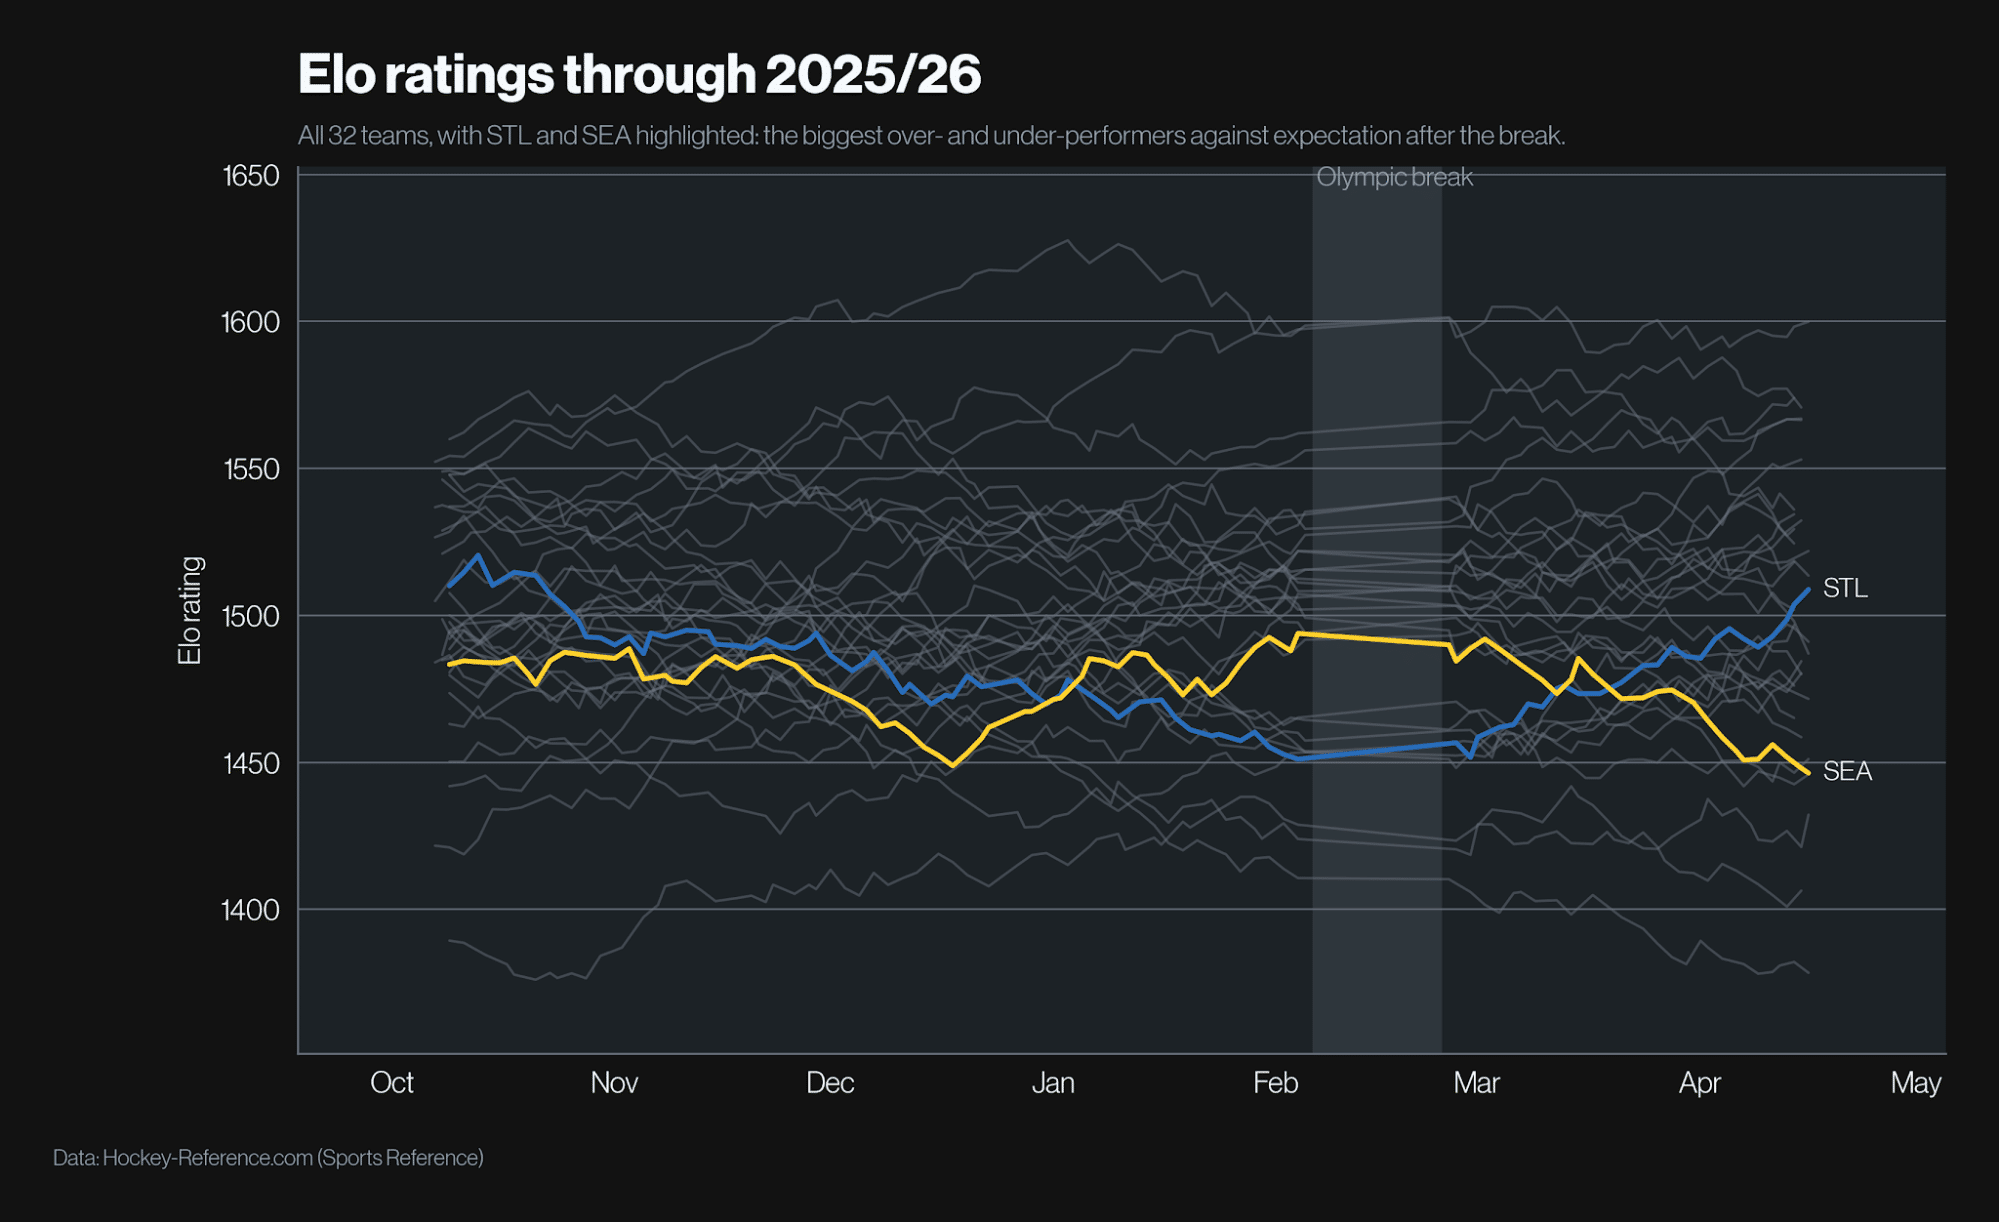
Every team’s Elo rating across the 2025–26 season. The shaded area marks the Olympic break. St. Louis and Seattle are highlighted.
Ratings moved after the break, as they do in most seasons. St. Louis beat its forecast by the most, finishing 11.8 points above expectations, and still missed the playoffs. Seattle moved furthest the other way and missed for a third consecutive year.
There was no clear relationship between the number of Olympians on a roster and how far a team finished above or below its expected points total. The finding held when we accounted for team strength and when we measured Olympic representation by the players’ share of team ice time rather than headcount.
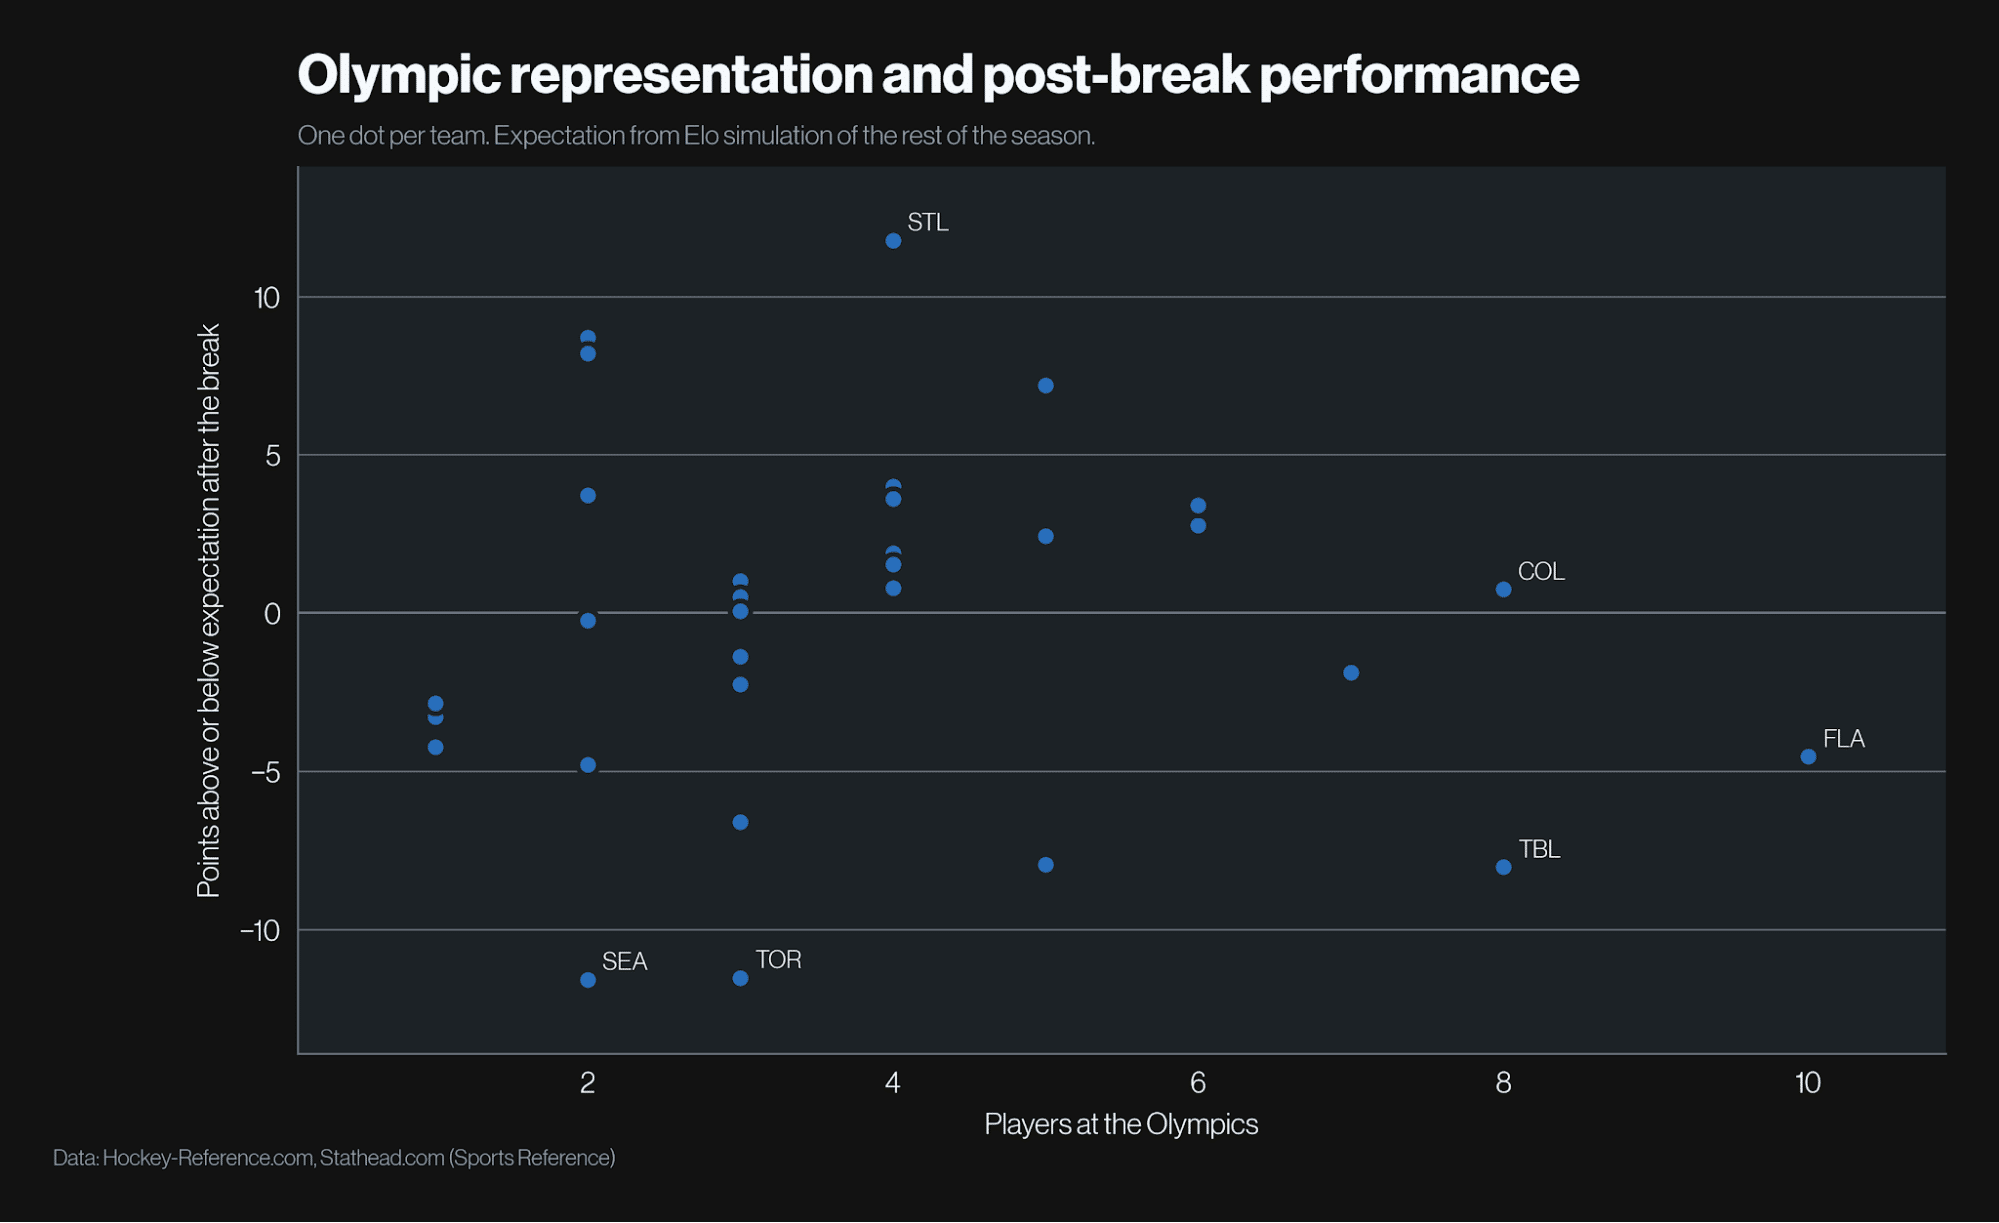
The number of Olympians on each roster compared with team points above or below forecast after the break. There is no clear trend.
Teams with similar Olympic representation had different outcomes. Tampa Bay and Colorado each had eight Olympians, but Tampa Bay finished eight points below expectations while Colorado finished on expectation. Florida, with 10 Olympians, finished 4.5 points below its forecast.
The end of the 2025–26 season did produce more unexpected results than the simulations anticipated. But that was not unique to the Olympic season. The 2024–25 season, which included the 4 Nations break, and the 2022–23 season, which had neither break, also showed more movement than expected. An unpredictable finish was not, by itself, evidence of an Olympic effect.
Olympians played slightly less after returning
Team results tell only part of the story. To examine individual players, we compared the 25 team games before the break with the first 10 team games after it. We looked at how Olympians changed relative to other NHL skaters, including non-Olympians with similar levels of NHL ice time. That comparison matters because Olympic players are not a typical sample of the league. Many are among its most heavily used players.
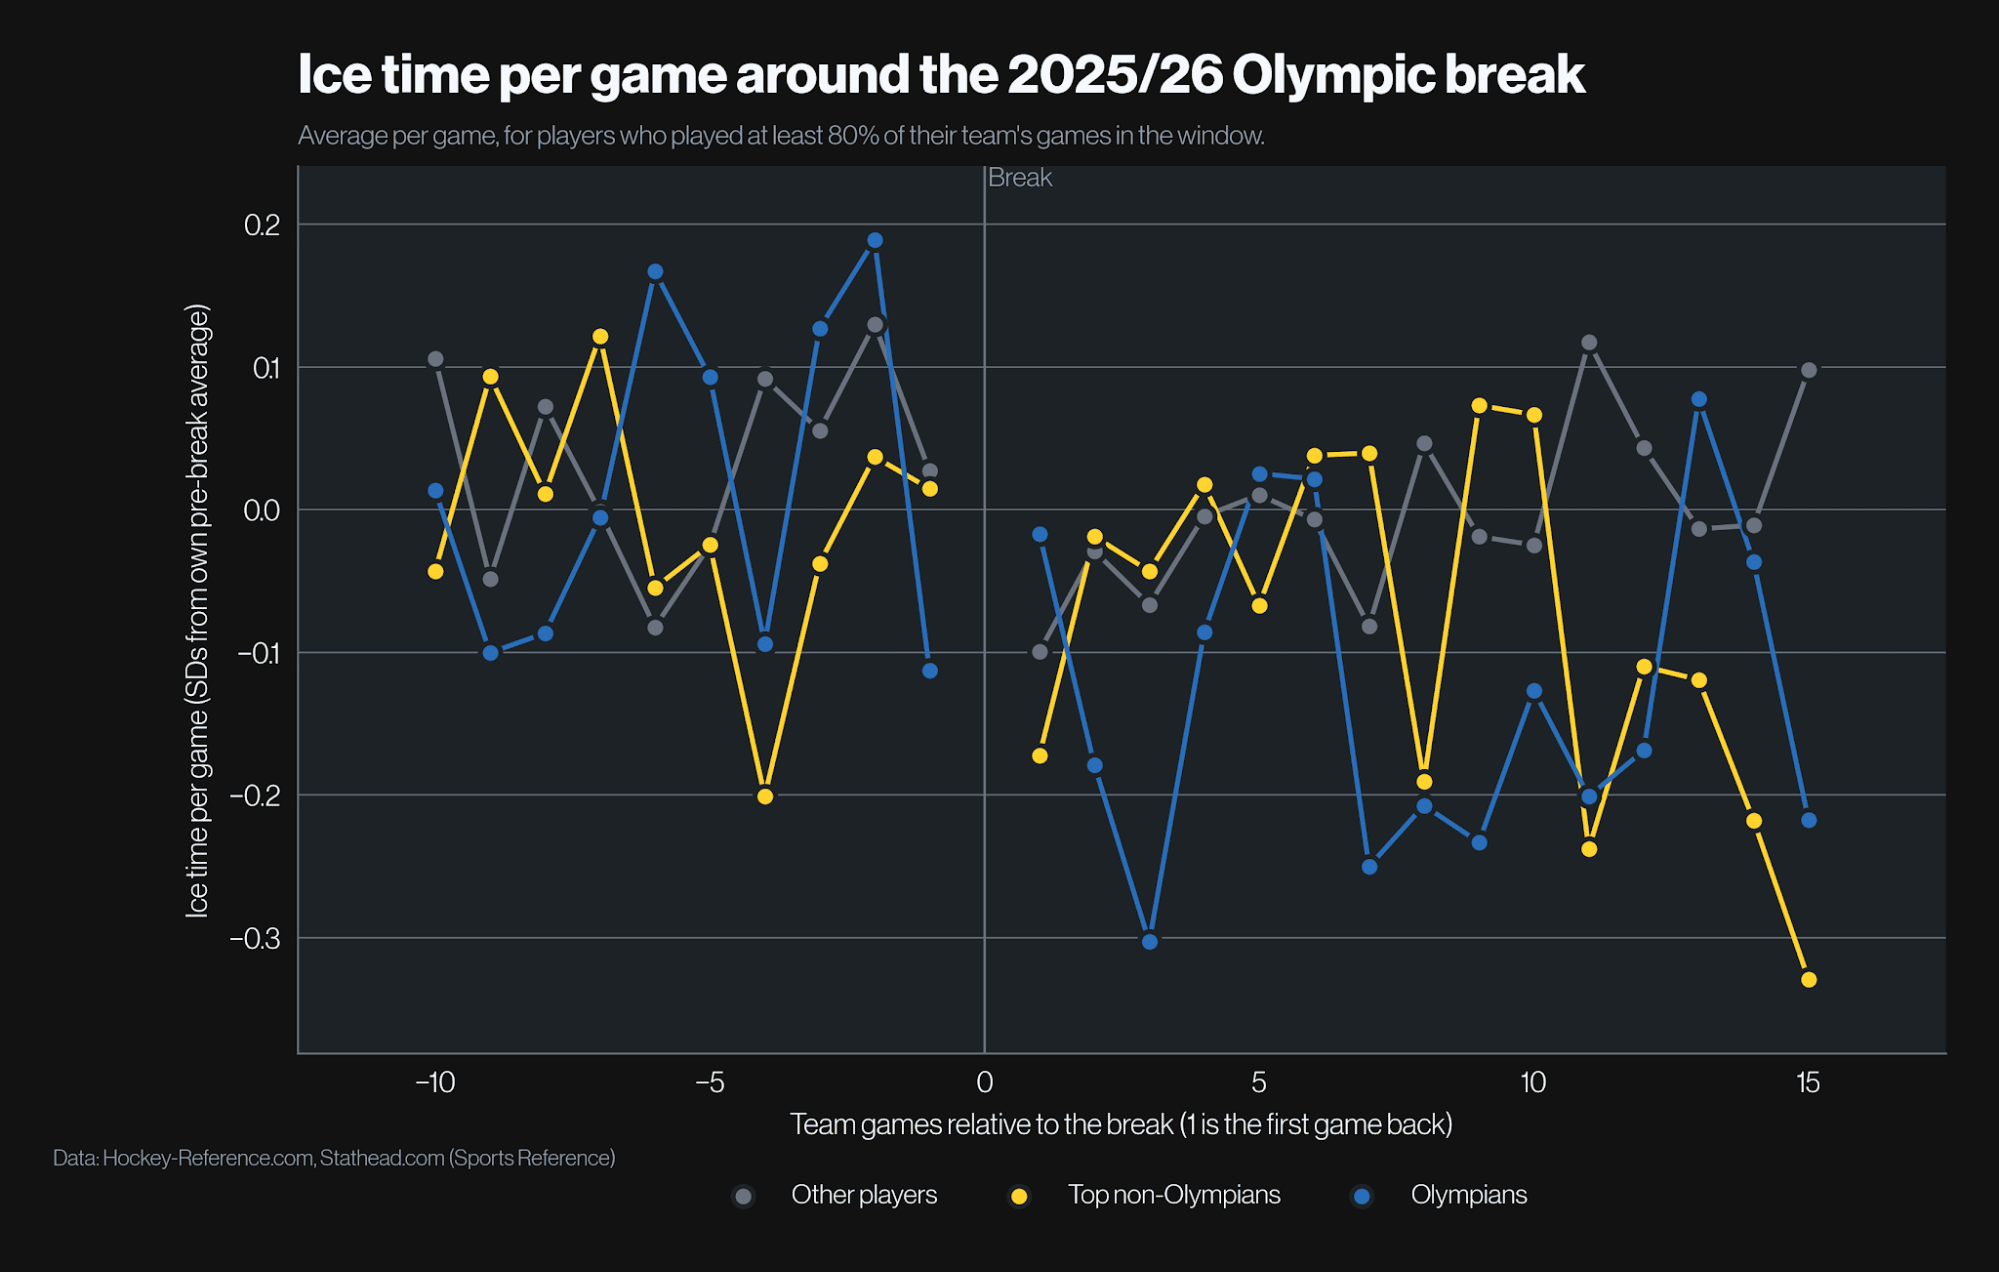
Changes in ice time per game for Olympians, comparable non-Olympians, and other skaters in the games before and after the Olympic break.
Across the first 10 team games back, Olympians’ ice time fell by roughly 20 seconds per game relative to the change among comparable non-Olympians. This does not mean Olympians played 20 seconds less than those players overall. It describes the difference in how their playing time changed after the break.
The reduction was clearest among forwards, at about 25 seconds per game relative to comparable non-Olympians. The result for defensemen was less clear. That does not mean defensemen were unaffected, only that the evidence of a reduction was stronger for forwards.
We ran two further checks:
- A control comparison. We compared heavily used non-Olympians with other NHL skaters and found no clear difference in how their ice time changed after the break.
- A roster-size check. We repeated the comparison using non-Olympians from teams with two or fewer Olympians, where teammates were less likely to take on extra minutes. The reduction in Olympians’ ice time remained.
Missed games increased by similar amounts after the break: 2.4 percentage points for Olympians and 2.0 percentage points for everyone else.
Did less ice time mean a lower scoring rate?
We measured scoring rate using points per 60 minutes on the ice. This separates how much a player produces while playing from how much time they spend in the game.
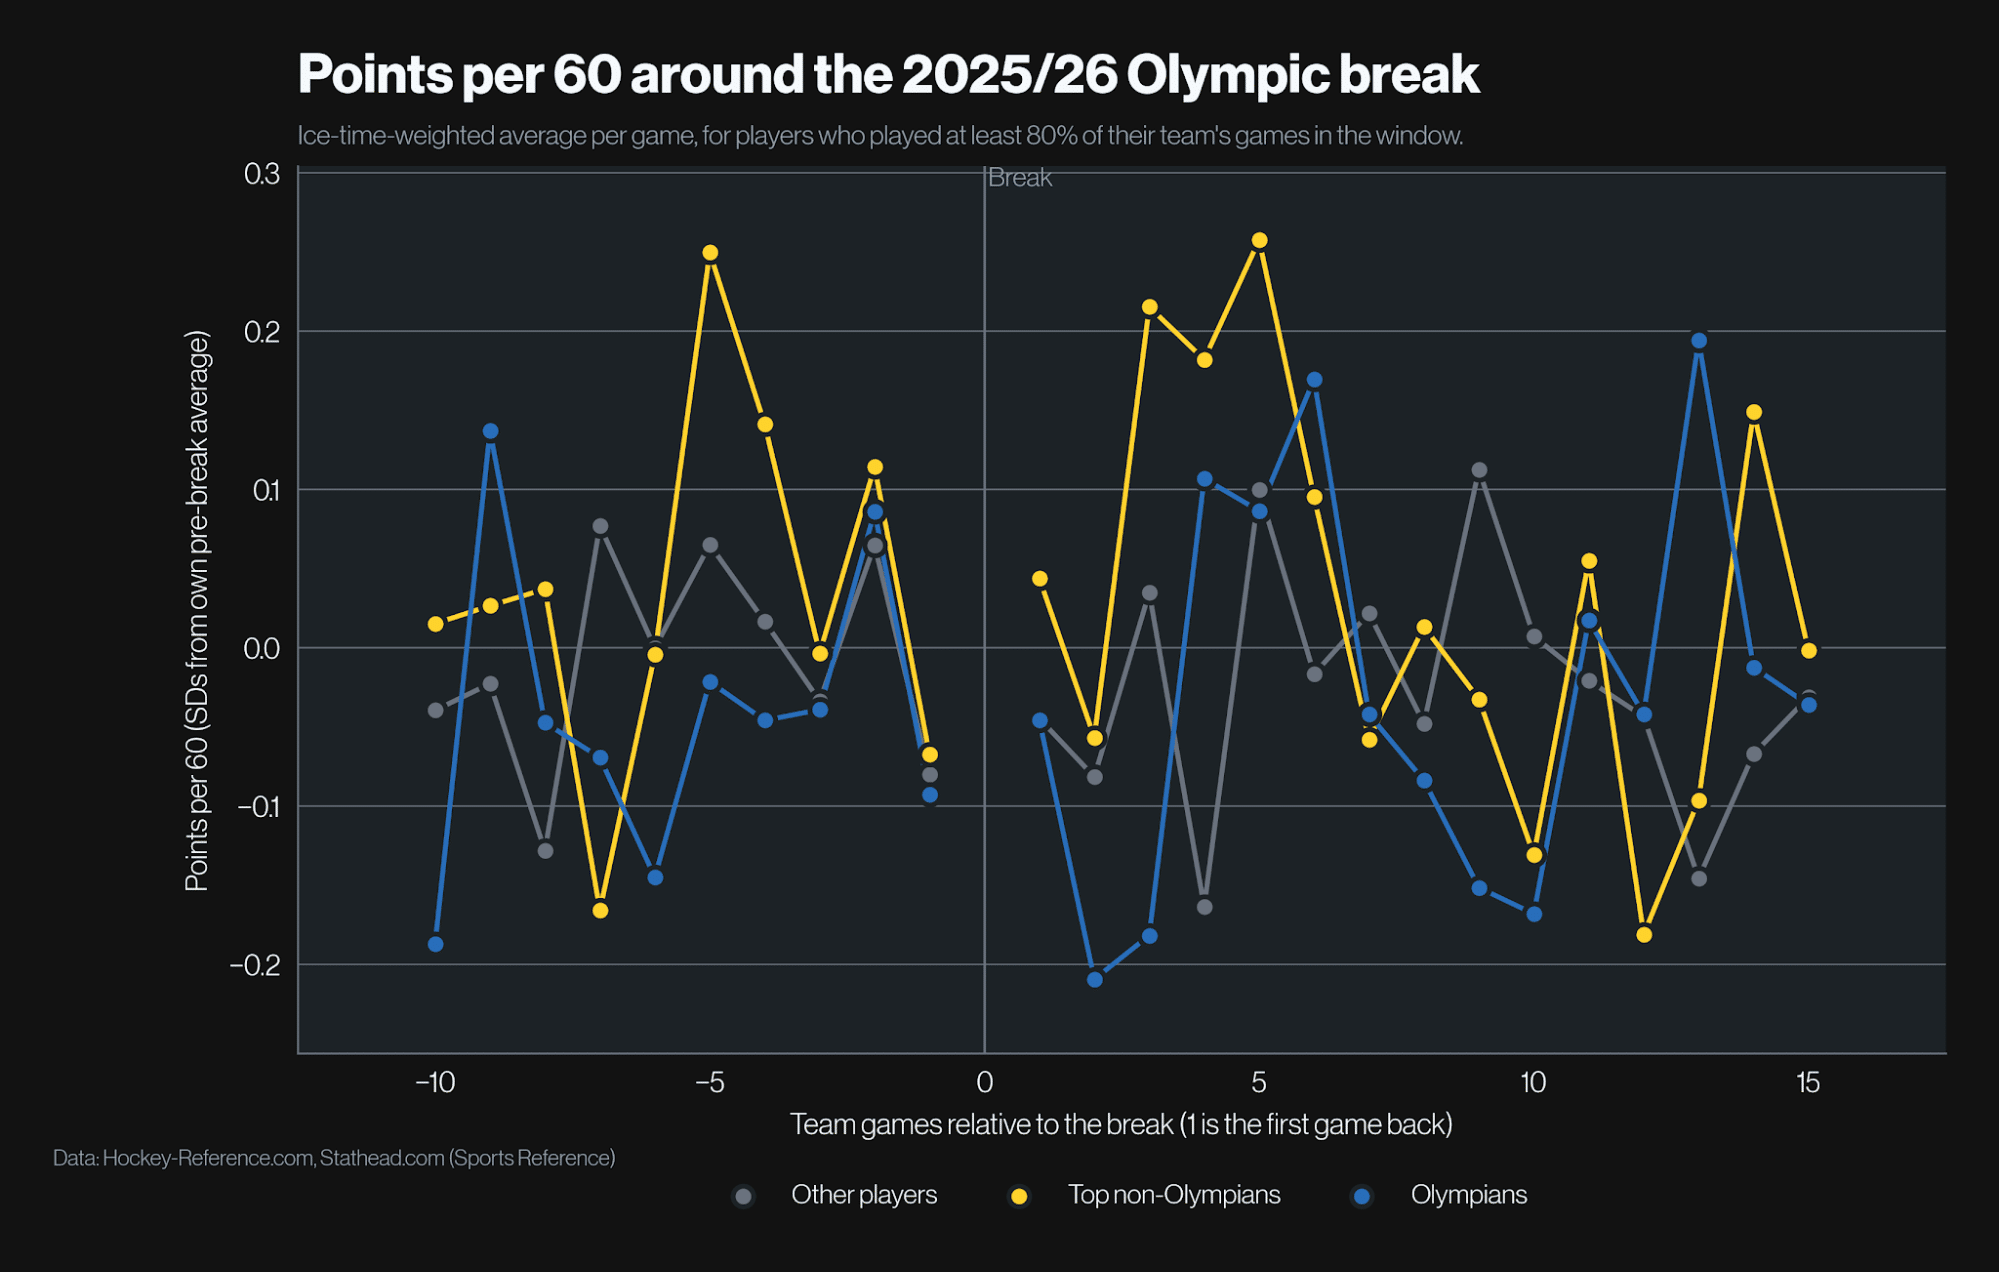
Changes in scoring rate for Olympians, comparable non-Olympians, and other skaters before and after the Olympic break.
Despite the reduction in ice time, Olympians’ scoring rate did not change significantly after the break. The scoring analysis also found no change that clearly set the 2025–26 season apart from the comparison seasons. In other words, the small reduction in playing time was not accompanied by clear evidence of lower scoring production while on the ice.
What the findings can and cannot tell us
The time window matters. We focused on the first 10 team games after the break to limit the influence of late-season changes as teams moved into different playoff positions. Over longer periods, the ice-time difference between Olympians and comparable non-Olympians was no longer statistically clear. Other heavily used players also lost minutes, making an Olympic-specific effect harder to separate from wider late-season patterns.
The comparison group matters too. The short-term reduction stood out from earlier seasons when Olympians were compared with similarly used non-Olympians. It did not stand out as clearly when they were compared with all other skaters. We also used a 25-game pre-break comparison because Olympians’ ice time had risen in the final five games before the break, mainly among defensemen. Comparing only with those final games would have made the decline look larger.
The team findings need similar care. With only 32 teams, the analysis was better able to detect a large effect than a small one. No clear relationship does not prove there was no effect. And a reduction in ice time does not, on its own, explain why it happened or establish that Olympic participation caused fatigue.
What this means for performance staff
For coaches, performance staff, and analysts, the takeaway is to look at ice time, scoring rate, and team results separately. A change in one does not automatically mean a change in the others.
Here, Olympians’ ice time fell slightly relative to comparable players, but their scoring rate showed no clear change. We also found no clear link between the number of Olympians on a team and finishing below expectations.
The change in ice time is worth watching. After a compressed run of high-intensity Olympic games, forwards came back to slightly fewer minutes. Teams may have been managing those players’ workload, but we cannot tell from the data whether that was a deliberate choice. Either way, ice time is usually where this kind of decision shows up first.
Earlier research offers some context. A study of the 2014 Sochi Olympics found the effect on scoring after the Games to be minimal. There was one small difference: forwards who played more minutes at the Olympics scored slightly fewer points per game when they returned.
How we ran the analysis
Team analysis. The Elo model was tuned using the 2017–18 and 2018–19 seasons, then tested on later seasons. The 2025–26 season was not used to set up the model. It accounted for home advantage and back-to-back games, among other settings. Comparison seasons were assessed from the same point in the schedule, around 69% of the season completed.
Player analysis. We compared each player with their own usual level, then compared the changes among Olympians with those among non-Olympians. The models accounted for opponent strength, rest days, back-to-back games, and home or away games. We also tested similar player groups in five earlier seasons, matching historical players by position, ice time, and scoring rate. The two COVID-disrupted seasons and the 2024–25 season containing the 4 Nations break were excluded from those comparisons.
What it adds up to
The Olympic break did not cost teams the rest of their season. The only sign of it was in minutes, for forwards, over a short run of games.
That is why ice time, scoring rate and team results are worth looking at separately. A break can change how a team uses a player without changing what that player produces, and a season can end oddly for reasons that have nothing to do with a tournament in February.
Kitman Labs works with teams, leagues and federations across global sport. iP: Intelligence Platform brings performance, medical and training data into one place, so staff can see how players are being used and make informed decisions about load, availability and return to play. To find out more, contact sales@kitmanlabs.com.