Medical teams play a crucial role in safeguarding athlete health and optimizing performance. Injury surveillance, which includes understanding injury causes, monitoring trends, and evaluating treatment outcomes, is essential for reducing risk and improving athlete care. However, efficiently collecting, analyzing, and visualizing injury data has often been a challenge—until now.
The Self-Service Reporting capabilities in iP: Intelligence Platform provide medical staff with intuitive, flexible, and dynamic reporting tools to support injury surveillance and evidence-based decision-making. With the latest improvements, including Charts+ and the Formula Feature in Tables, medical practitioners can quickly analyze injury trends, compare data across squads, and communicate findings with greater impact.
Simplifying Injury Data Analysis
Gone are the days of manual data exports and static reports. Self-Service Reporting in IP enables medical teams to:
- Access comprehensive medical data alongside performance, availability, and workload data.
- Group and categorize data in multiple ways, such as by injury type, position group, or contact mechanism.
- Create intuitive, interactive reports that update in real time, supporting faster insights and decisions.
These capabilities make it easier to track injury patterns, recurrence rates, and contributing factors, ensuring medical teams have the data they need to proactively manage athlete health.
Advanced Visualization with Charts+
Medical practitioners need clear, insightful visuals to detect patterns and trends. With Charts+, users can:
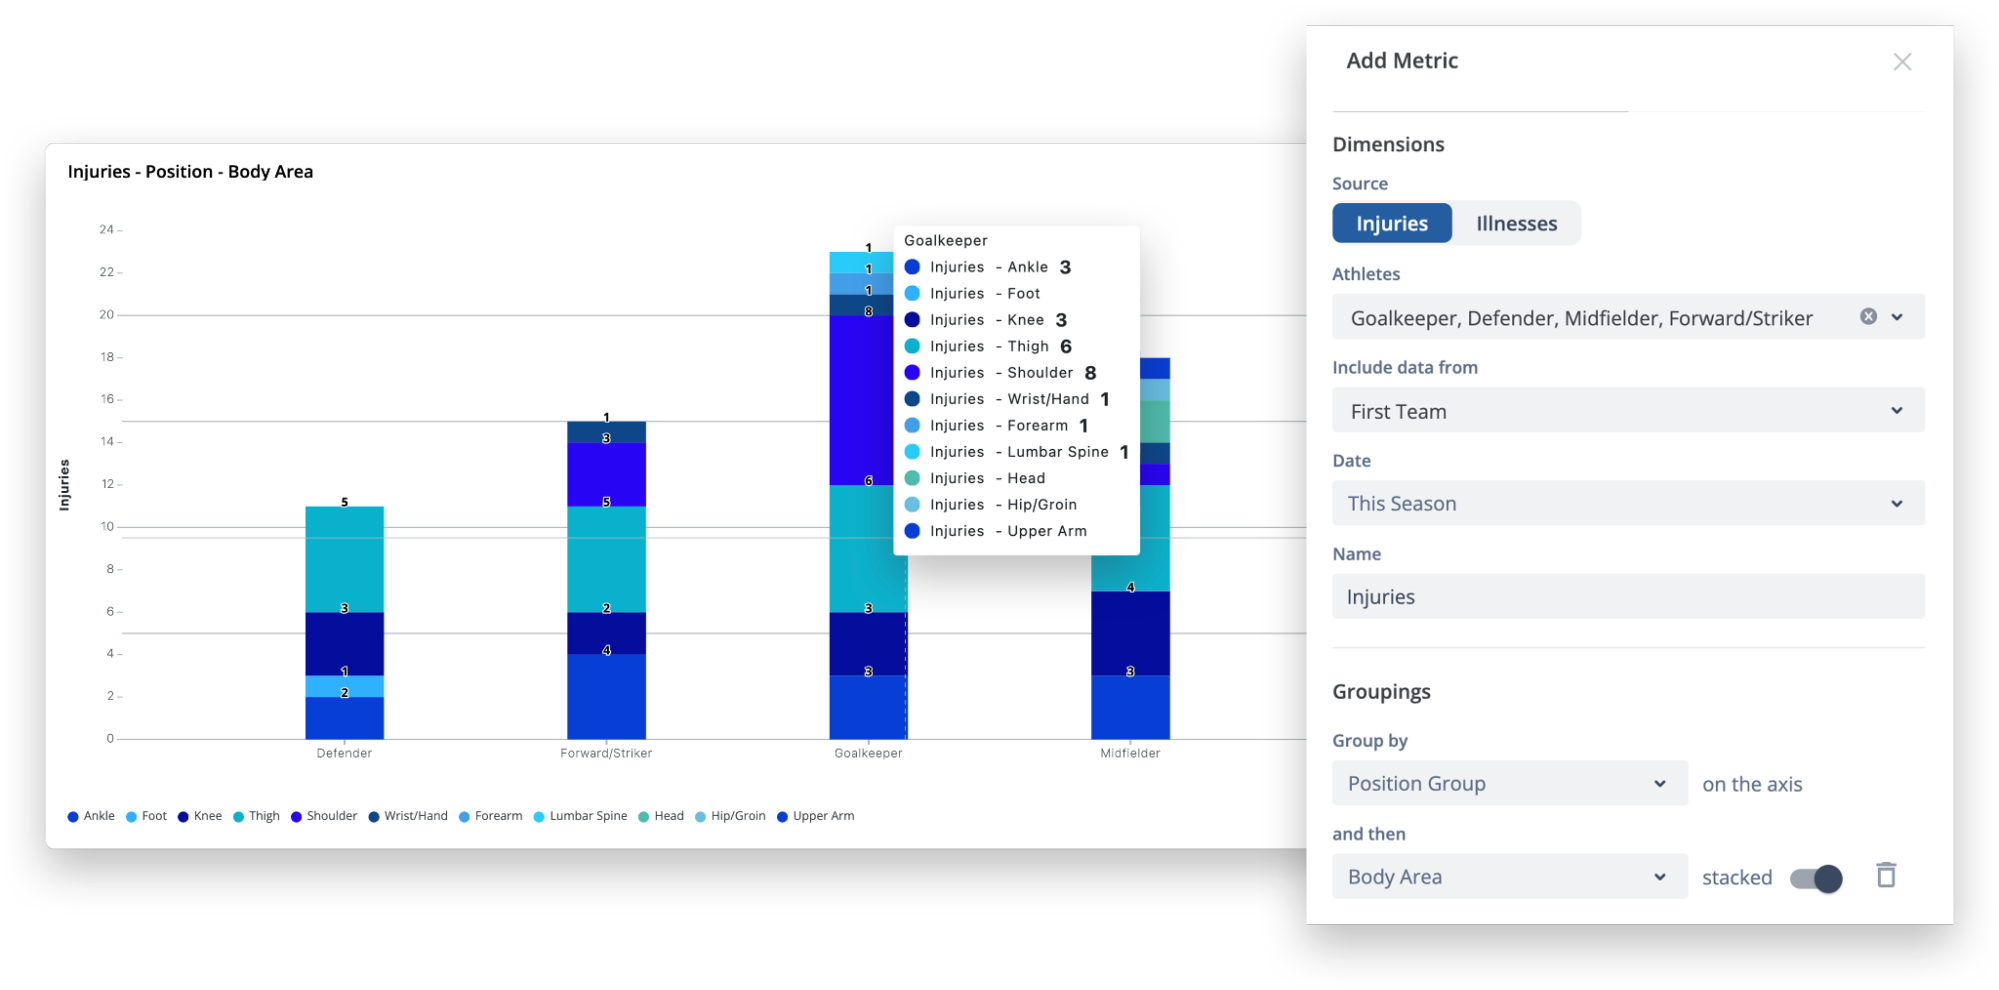
- Build stacked bar charts, line graphs, and combo charts to visualize injury trends over time.
- Group data dynamically by injury location, position group, and mechanism.
- Quickly preview and iterate on reports without navigating between screens.
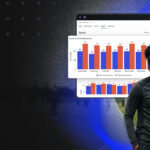
For example, a stacked bar chart comparing injury types by position group might reveal that goalkeepers experience more shoulder injuries than any other position—a valuable insight for injury prevention planning.
Unlocking Deeper Insights with the Formula Feature in Tables
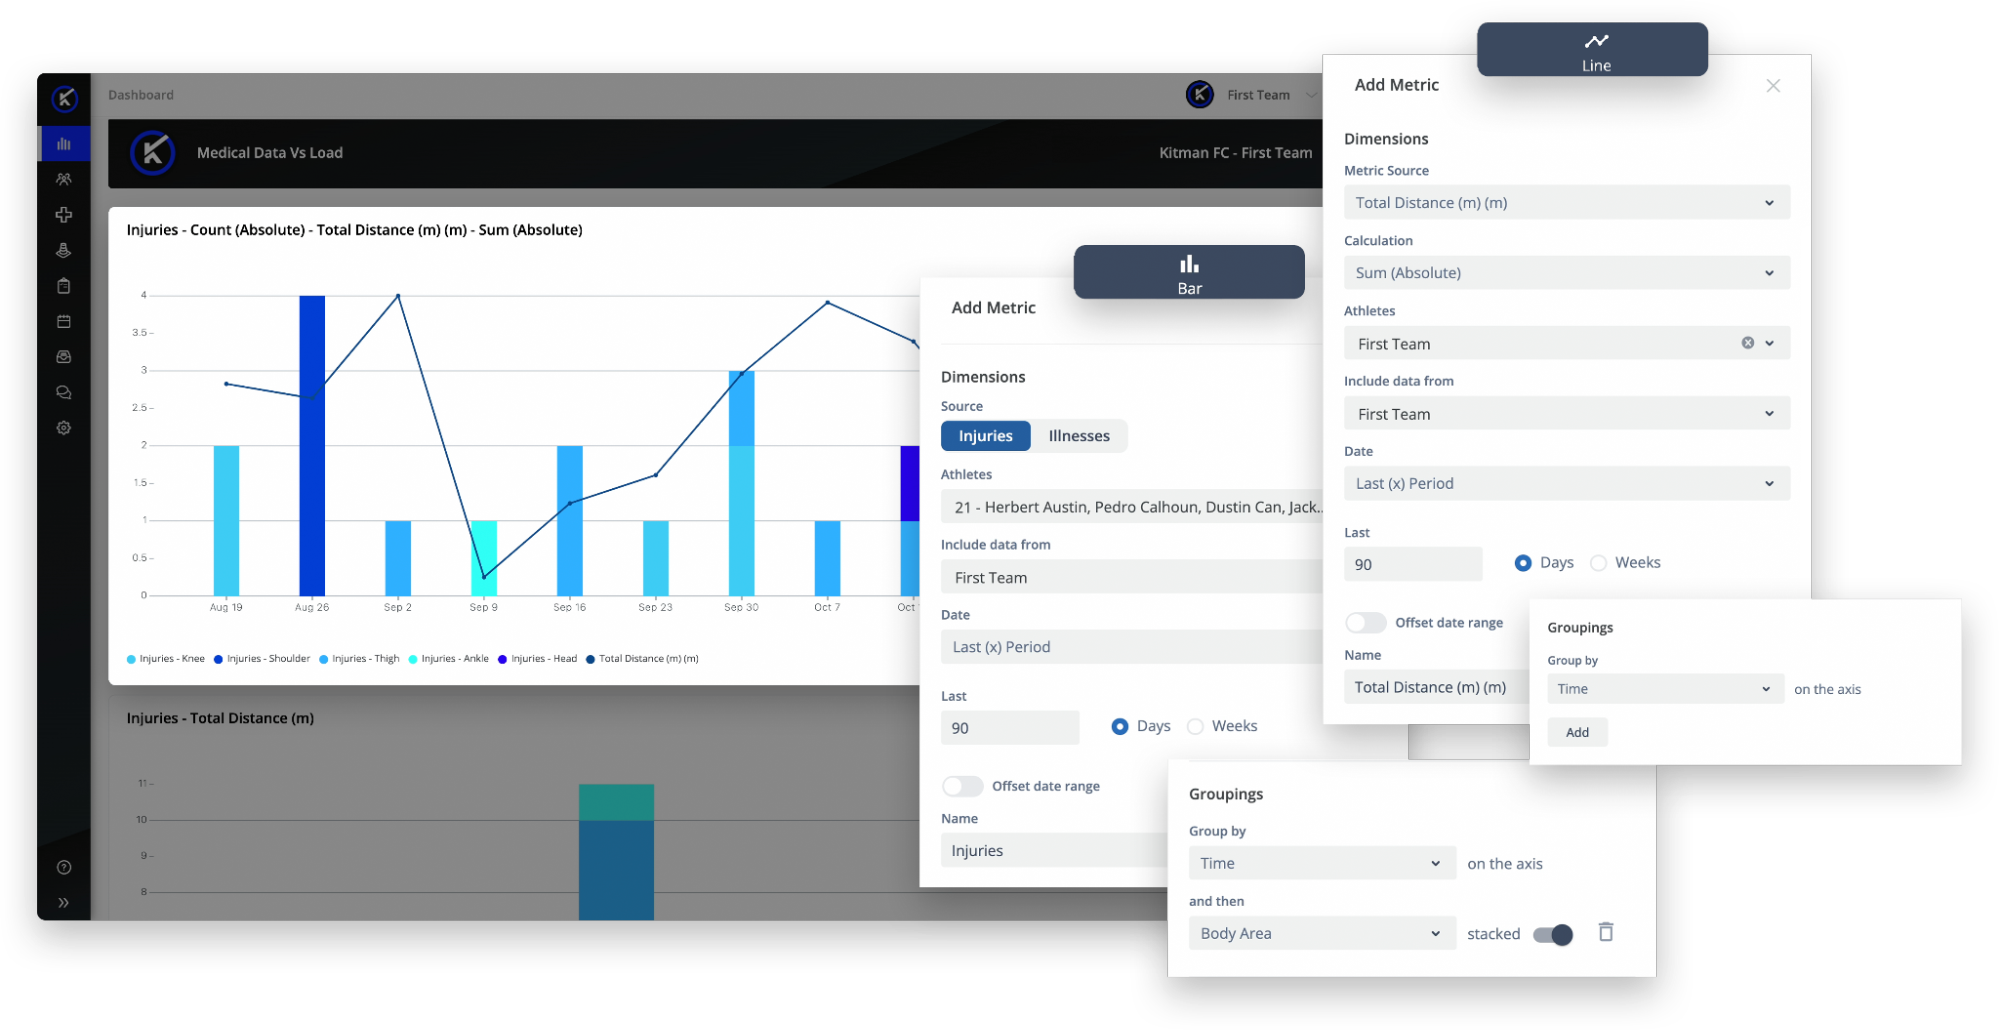
Benchmarking and comparative analysis are critical for understanding injury prevalence and recovery trends. The Formula Feature in Tables allows users to:
- Compare an athlete’s injury history against squad or league-wide benchmarks.
- Track time-loss effects of specific injuries over a season.
- Apply customized filters to assess injury severity and contributing factors.
For example, medical teams can track hamstring injuries vs. knee injuries across the squad over the past 60 days, filtering by injury severity and recovery time. This level of granularity helps teams adjust training loads and mitigate re-injury risks.
Use Cases: Injury Surveillance & Prevention
With Self-Service Reporting, medical staff can customize their analysis to address specific injury surveillance needs. Here’s how:
Injury Trends & Position-Specific Risk Analysis
Using stacked bar charts, teams can assess injury occurrence by position group. For instance:
- A higher rate of shoulder injuries among goalkeepers may indicate a need for targeted prevention strategies.
- Analyzing contact vs. non-contact injuries can provide insights into injury mechanisms and training load adjustments.
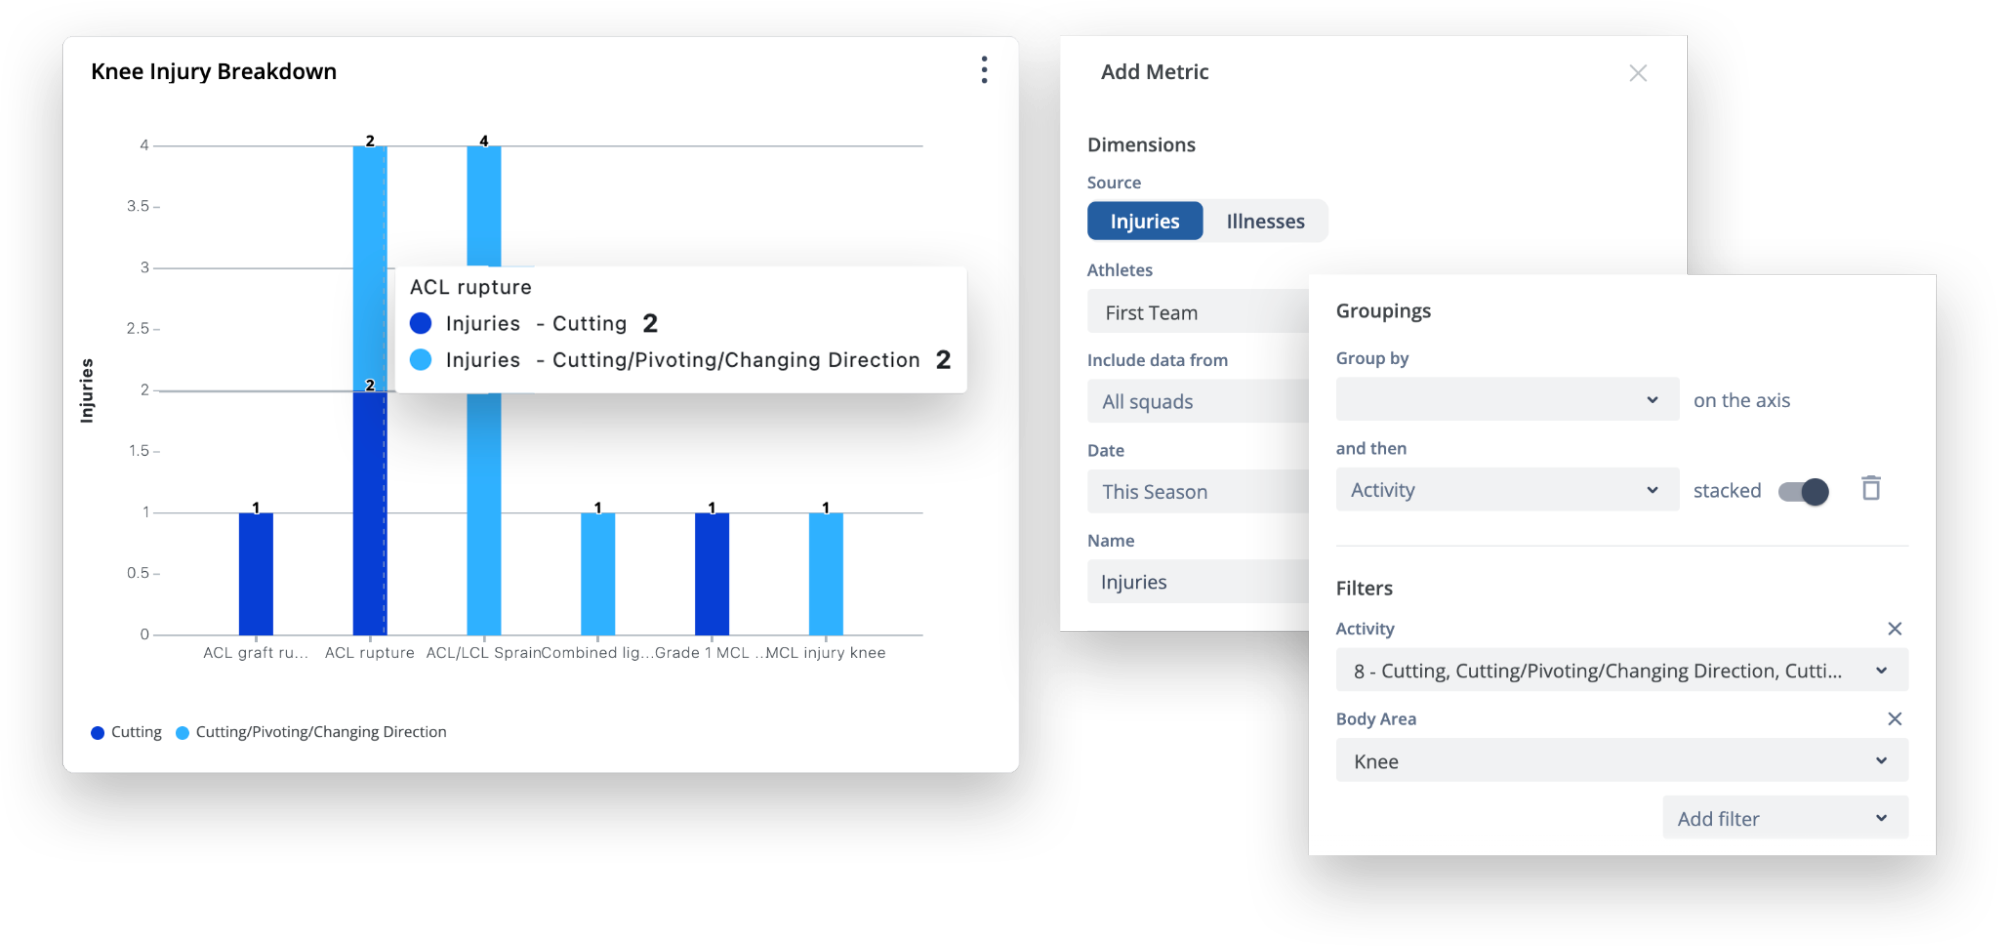
Injury Occurrence & Contact Type Analysis
Practitioners can analyze how injuries occur by categorizing them by mechanism (contact, non-contact) and activity type (change-of-direction, sprinting, tackling, etc.).
- If an athlete experiences multiple knee injuries during change-of-direction activities, staff may adjust training plans to mitigate future risks.
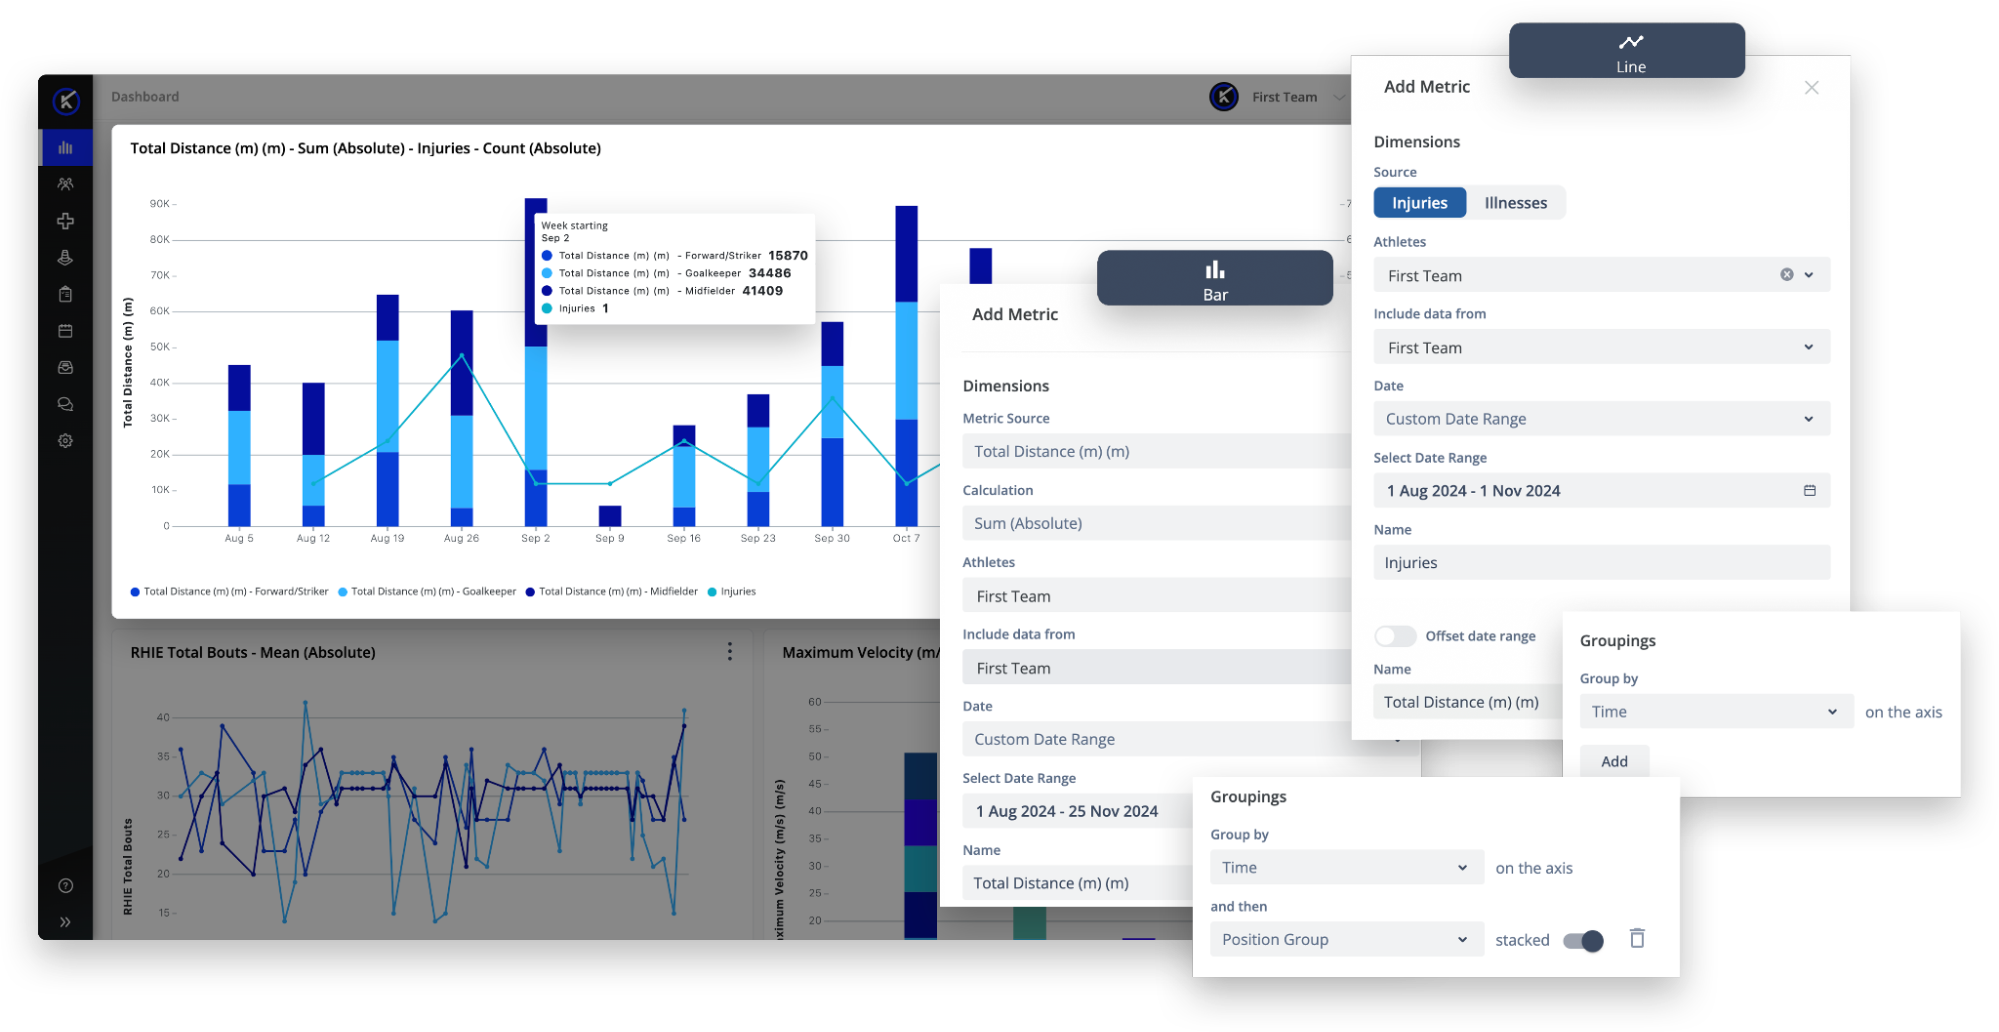
Longitudinal Injury Surveillance
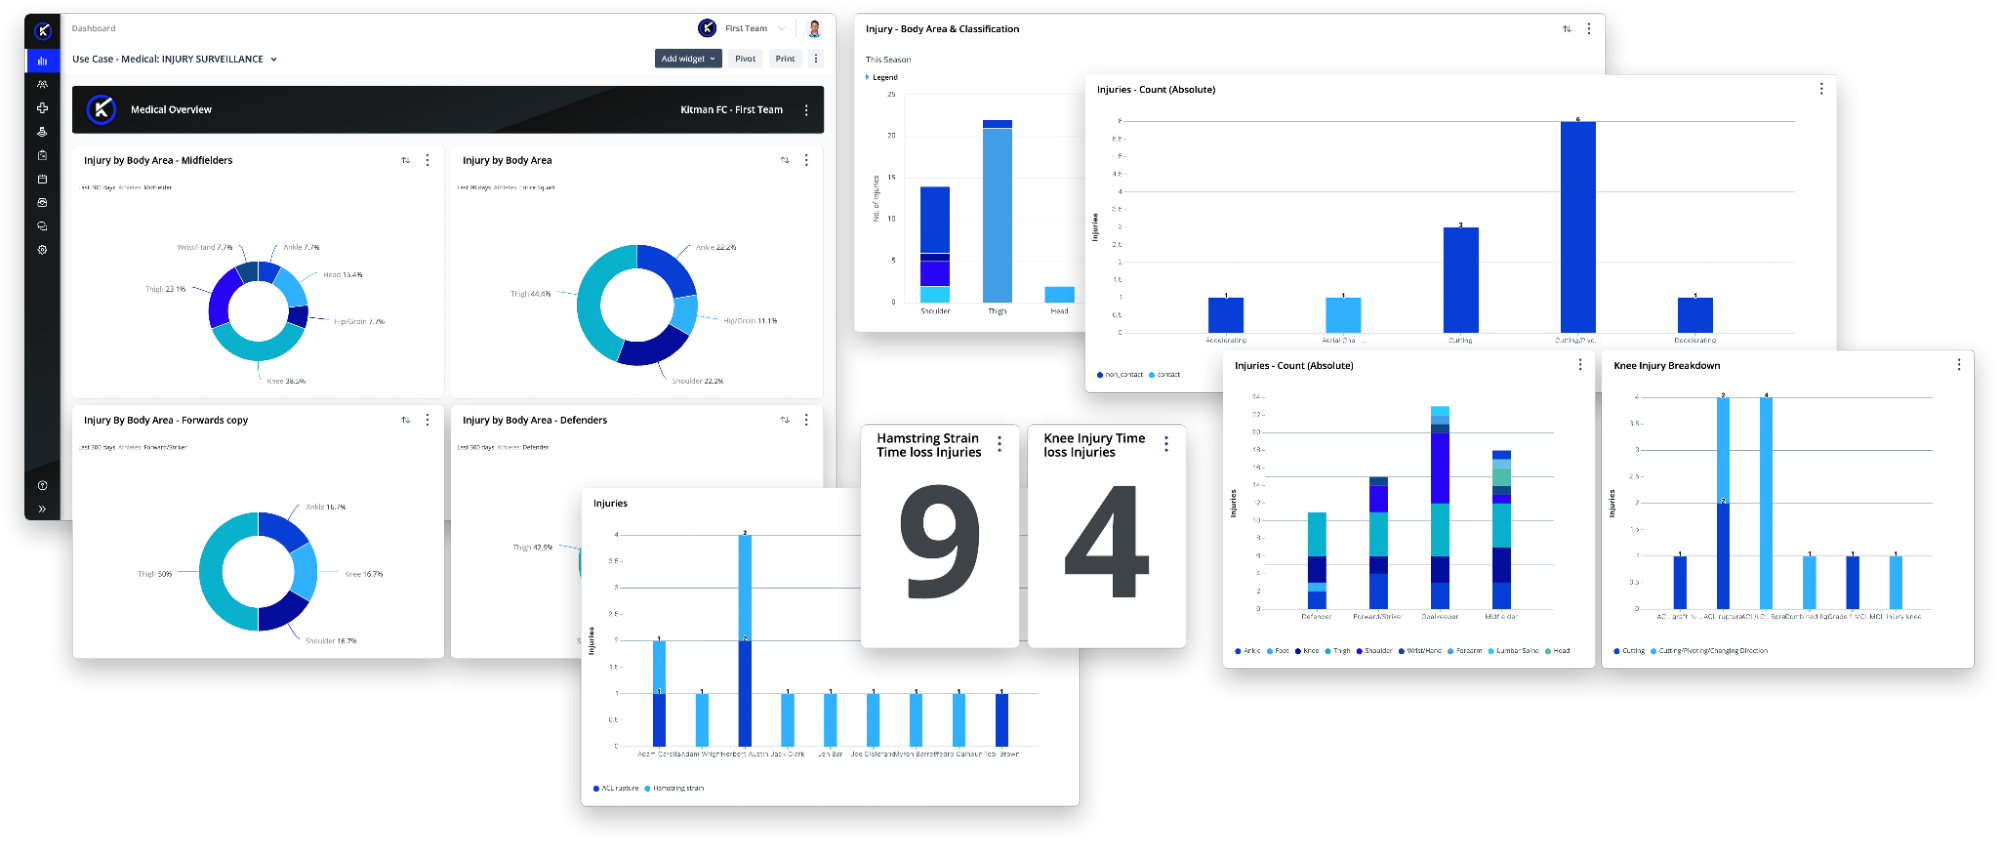
Tracking injuries over time helps identify patterns between training loads and injury occurrence. By creating a longitudinal combo chart, medical teams can:
- Compare injury frequency with total workload metrics (e.g., GPS total distance).
- Identify periods of increased injury risk and adjust workloads accordingly.
Injury Type & Time-Loss Impact
Understanding the impact of different injuries on availability is key to planning. Medical teams can:
- Filter reports by injury pathology (e.g., hamstring vs. knee injuries).
- Assess time-loss trends to refine rehabilitation and return to play strategies.
See Injury Surveillance Dashboard Reporting in Action
Watch how the Self-Service Reporting capabilities in iP: Intelligence Platform improve injury surveillance reporting by enabling medical teams to easily access and report on medical data and enabling those teams to efficiently analyze and communicate injury causes, trends, and impact. Practitioners can identify patterns based on position, contact type, and activity, allowing them to adjust training regimens to reduce recurrence.