Elite performance isn’t just about how fast an athlete can go—it’s about how often they’re exposed to those peak outputs in training and competition. Monitoring max velocity exposure is critical for speed development, return to play, and injury prevention. However, until now, tracking exposure across a squad over time has been inconsistent and disconnected.
Teams can already track top speed live during sessions using their GPS provider. But analyzing exposure across the week, and knowing when it’s not enough, is where most systems fall short.
The Challenge
In most environments, tracking max velocity exposure over time involves manual data collection, disconnected systems, and spreadsheets.
That makes it hard to:
- Monitor speed exposure relative to an individual’s true max
- Understand progressions week-to-week
- Identify under- or over-exposed athletes
- Compare exposure trends across age groups or units
The outcome: inconsistent progressions, elevated injury risk, and limited visibility across the squad or roster.
What We Hear from Clubs
Speed data is there, but actionable insight is often missing:
- “We can’t easily see who’s hitting their max velocity in a given week.”
- “It’s hard to compare exposure patterns across the squad.”
- “We want to build tolerance to high-speed running, but we’re flying blind.”
- “Our return to play plans lack speed exposure targets linked to max effort.”
As the person responsible for managing training loads and ensuring athletes hit appropriate intensities, you know how critical consistent high-speed exposure is—for performance gains and for reducing soft tissue injury risk, especially hamstrings.
The challenge? Knowing when athletes aren’t hitting the thresholds they should.
Even with available data, manually compiling it week by week slows you down and increases the risk of missed interventions.
The Solution To the problem
With the Performance Optimization Solution in iP: Intelligence Platform, clubs can now measure and visualize each athlete’s exposure to max velocity automatically—without relying on spreadsheets or disconnected systems.
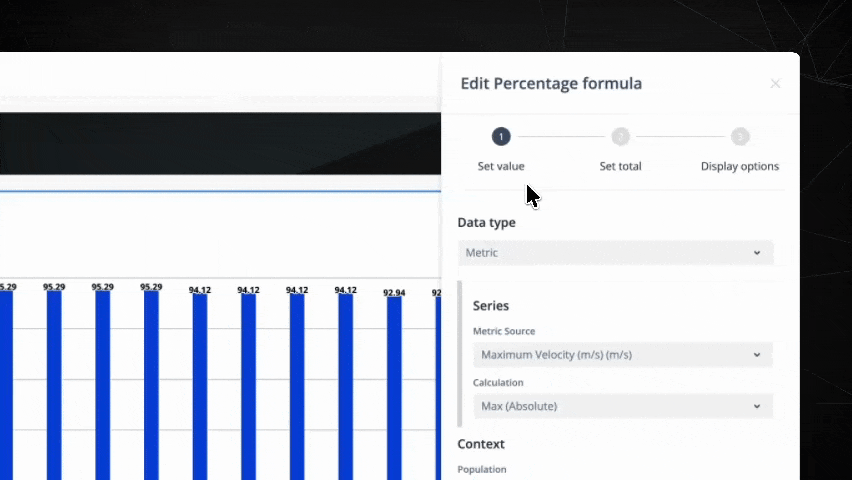
By using the Formula – Percentage feature within Self-Service Reporting in iP, practitioners can automatically calculate and chart the percentage of an athlete’s max velocity reached each week—at scale.
What You Can Do in Performance Optimization
Visualize Max Velocity Exposure at the Team Level
- In the Analysis section, create a dashboard and add an XY Chart.
- Use the ‘Add data’ option to select the Formula – Percentage calculation.
- Set the metric source to Maximum Velocity.
- Compare this week’s top speed against the athlete’s season-best to generate weekly exposure percentages.
Use Tables or Number Widgets for Fast Monitoring
- Apply the same formula to table or number value widgets to track individuals at a glance.
- Add filters to view by squad, position, or phase of training.
Track Individual Max Velocity Progression
- For raw speed output over time, build a longitudinal graph.
- Input Maximum Velocity as the data source and apply the Max (Absolute) calculation.
- Use the pivot function to toggle between athletes and observe velocity trends.