In today’s fast-paced sports environment, data-driven decision-making is more important than ever. Coaches, medical staff, and performance analysts need real-time access to meaningful insights to optimize training, manage injuries, and enhance team performance. The self-service reporting capabilities in iP: Intelligence Platform enable users to configure, visualize, and analyze information with ease and immediacy.
Empowering Users with Intuitive Reporting
The self-service reporting capabilities in iP are designed for efficiency and flexibility. Users can effortlessly create reports and dashboards without the need for technical expertise. Key benefits include:
- Seamless Configuration – Setting up reports is intuitive and quick, allowing users to focus on insights rather than complex setup processes.
- Flexible Data Grouping – Users can organize and compare data in multiple ways to uncover trends and correlations.
- Expansive Data Access – A wide range of data types and calculations ensures a comprehensive view of athlete and team performance.
- Real-Time Data Updates – Reports dynamically refresh with the latest data, ensuring users always have up-to-date analysis.
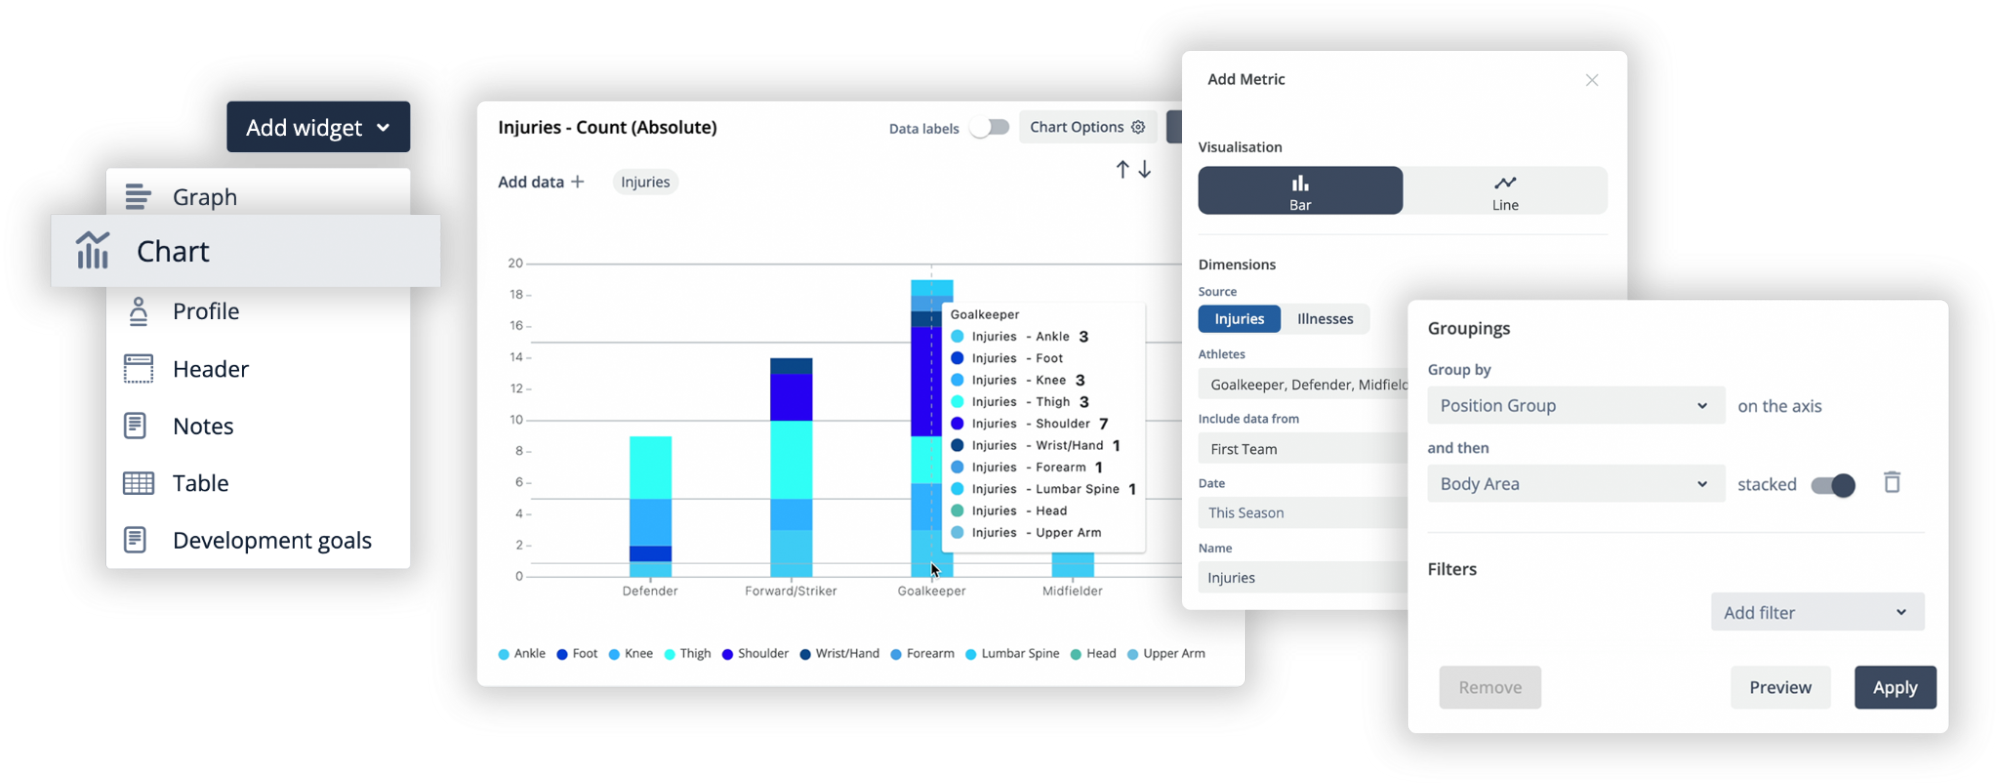
Bringing Data to Life with Charts+
The introduction of Charts+ in iP enhances visualization capabilities, making it easier than ever to generate impactful reports. With these new features, users can:
- Select from multiple visualization options, including bar charts, line charts, and stacked columns.
- Configure charts directly within their dashboard, eliminating the need to navigate through multiple pages.
- Apply custom groupings to analyze data across different dimensions, such as athlete, time, position, or squad.
- Quickly preview changes, ensuring the visualization aligns with the insights they need.
- Combine Multiple Data Sources, blend different data types into a single visualization (or series) for deeper contextual understanding.
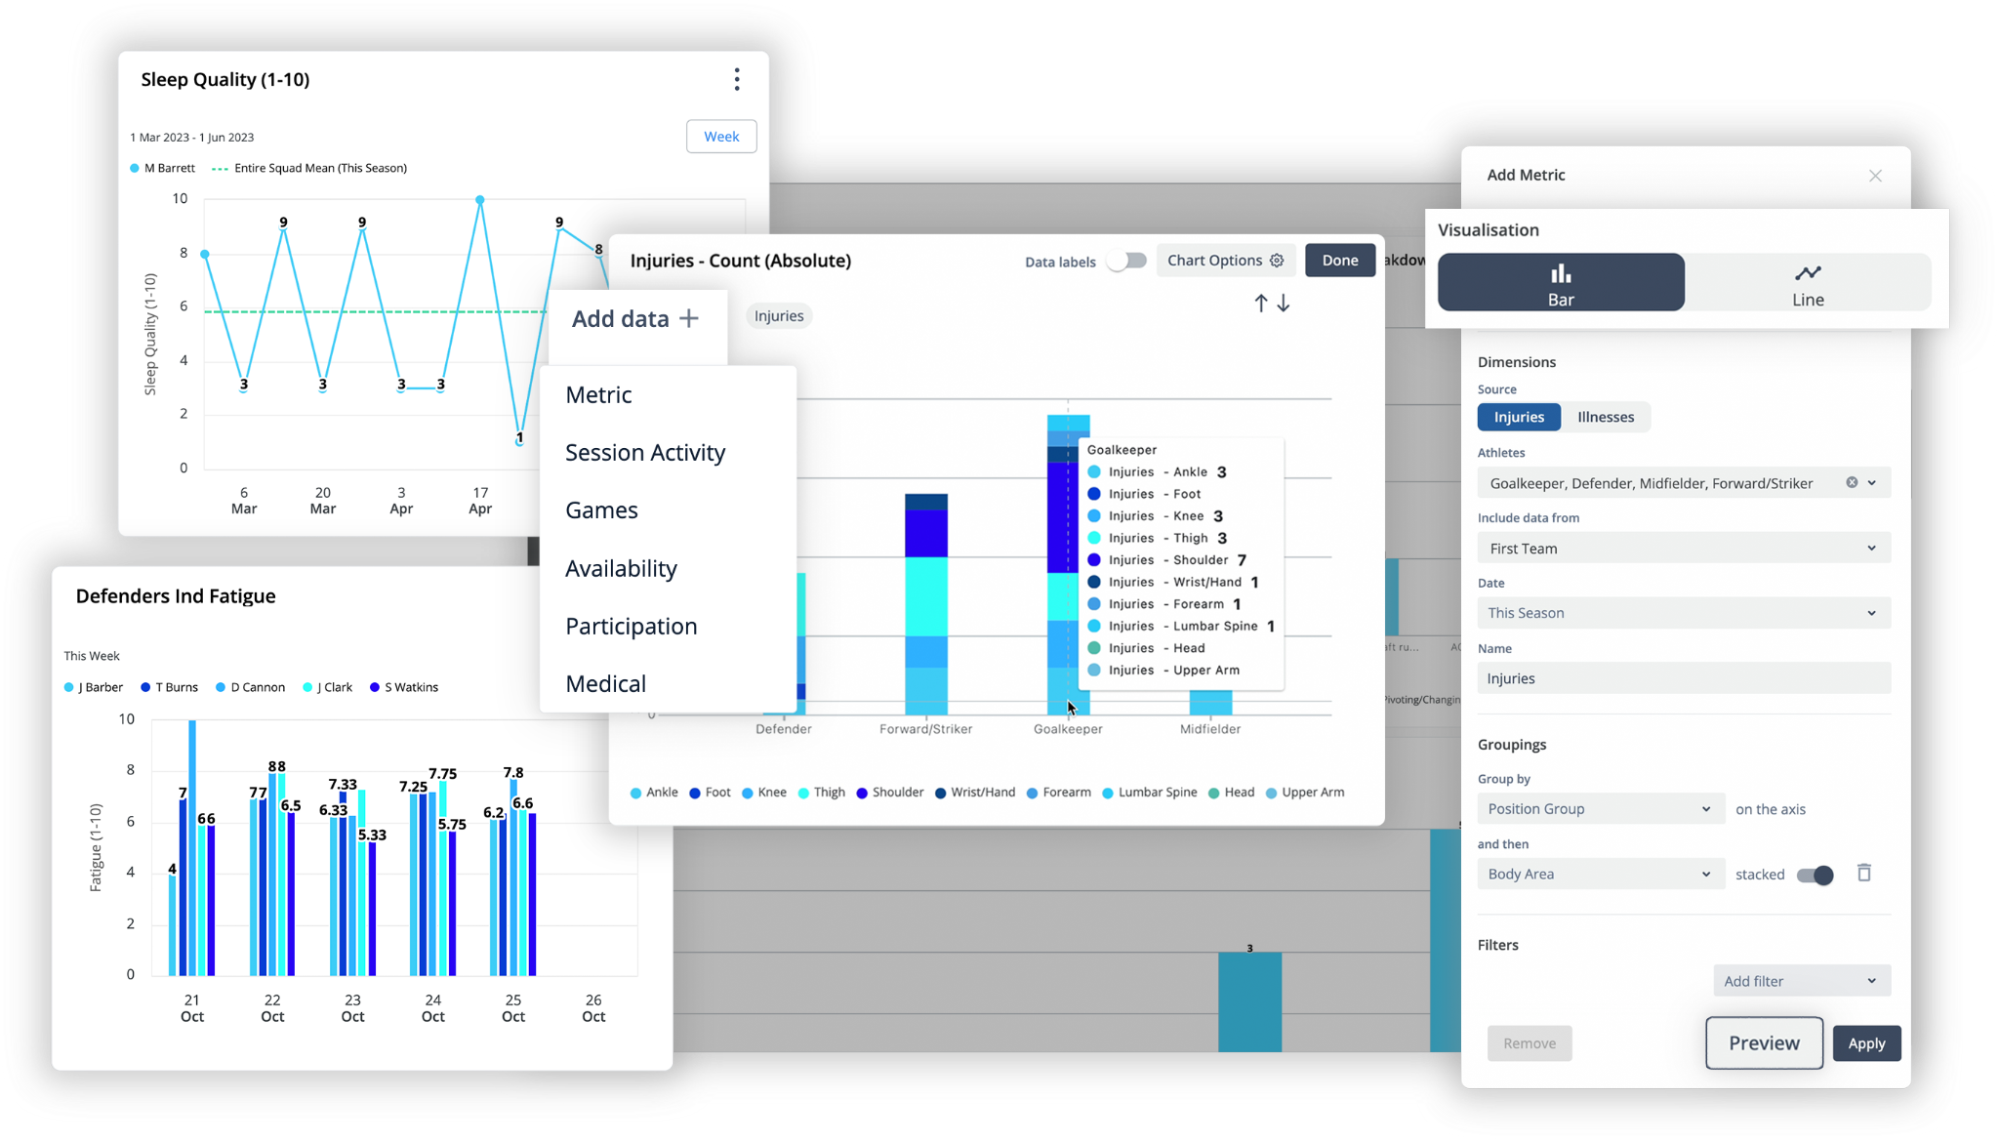
By offering a range of visual representation options, Charts+ allows users to create clear, compelling reports that highlight key performance trends, injury patterns, and training effectiveness.
Advanced-Data Analysis with the Formula Feature
Another powerful enhancement to self-service reporting is the Formula Feature in Tables. This capability enables users to generate custom calculations within table widgets, providing a deeper level of comparative and relative analysis. With this feature, users can:
- Leverage out-of-the-box formulas such as Percentage Change and Baseline Comparisons to track performance shifts over time.
- Compare data from different time periods, data sources, and populations in a single table.
- Filter formulas based on event types to conduct precise, event-specific analysis.
- Benchmark Against Peers – Compare individual and squad-level metrics to league or historical data for performance tracking.
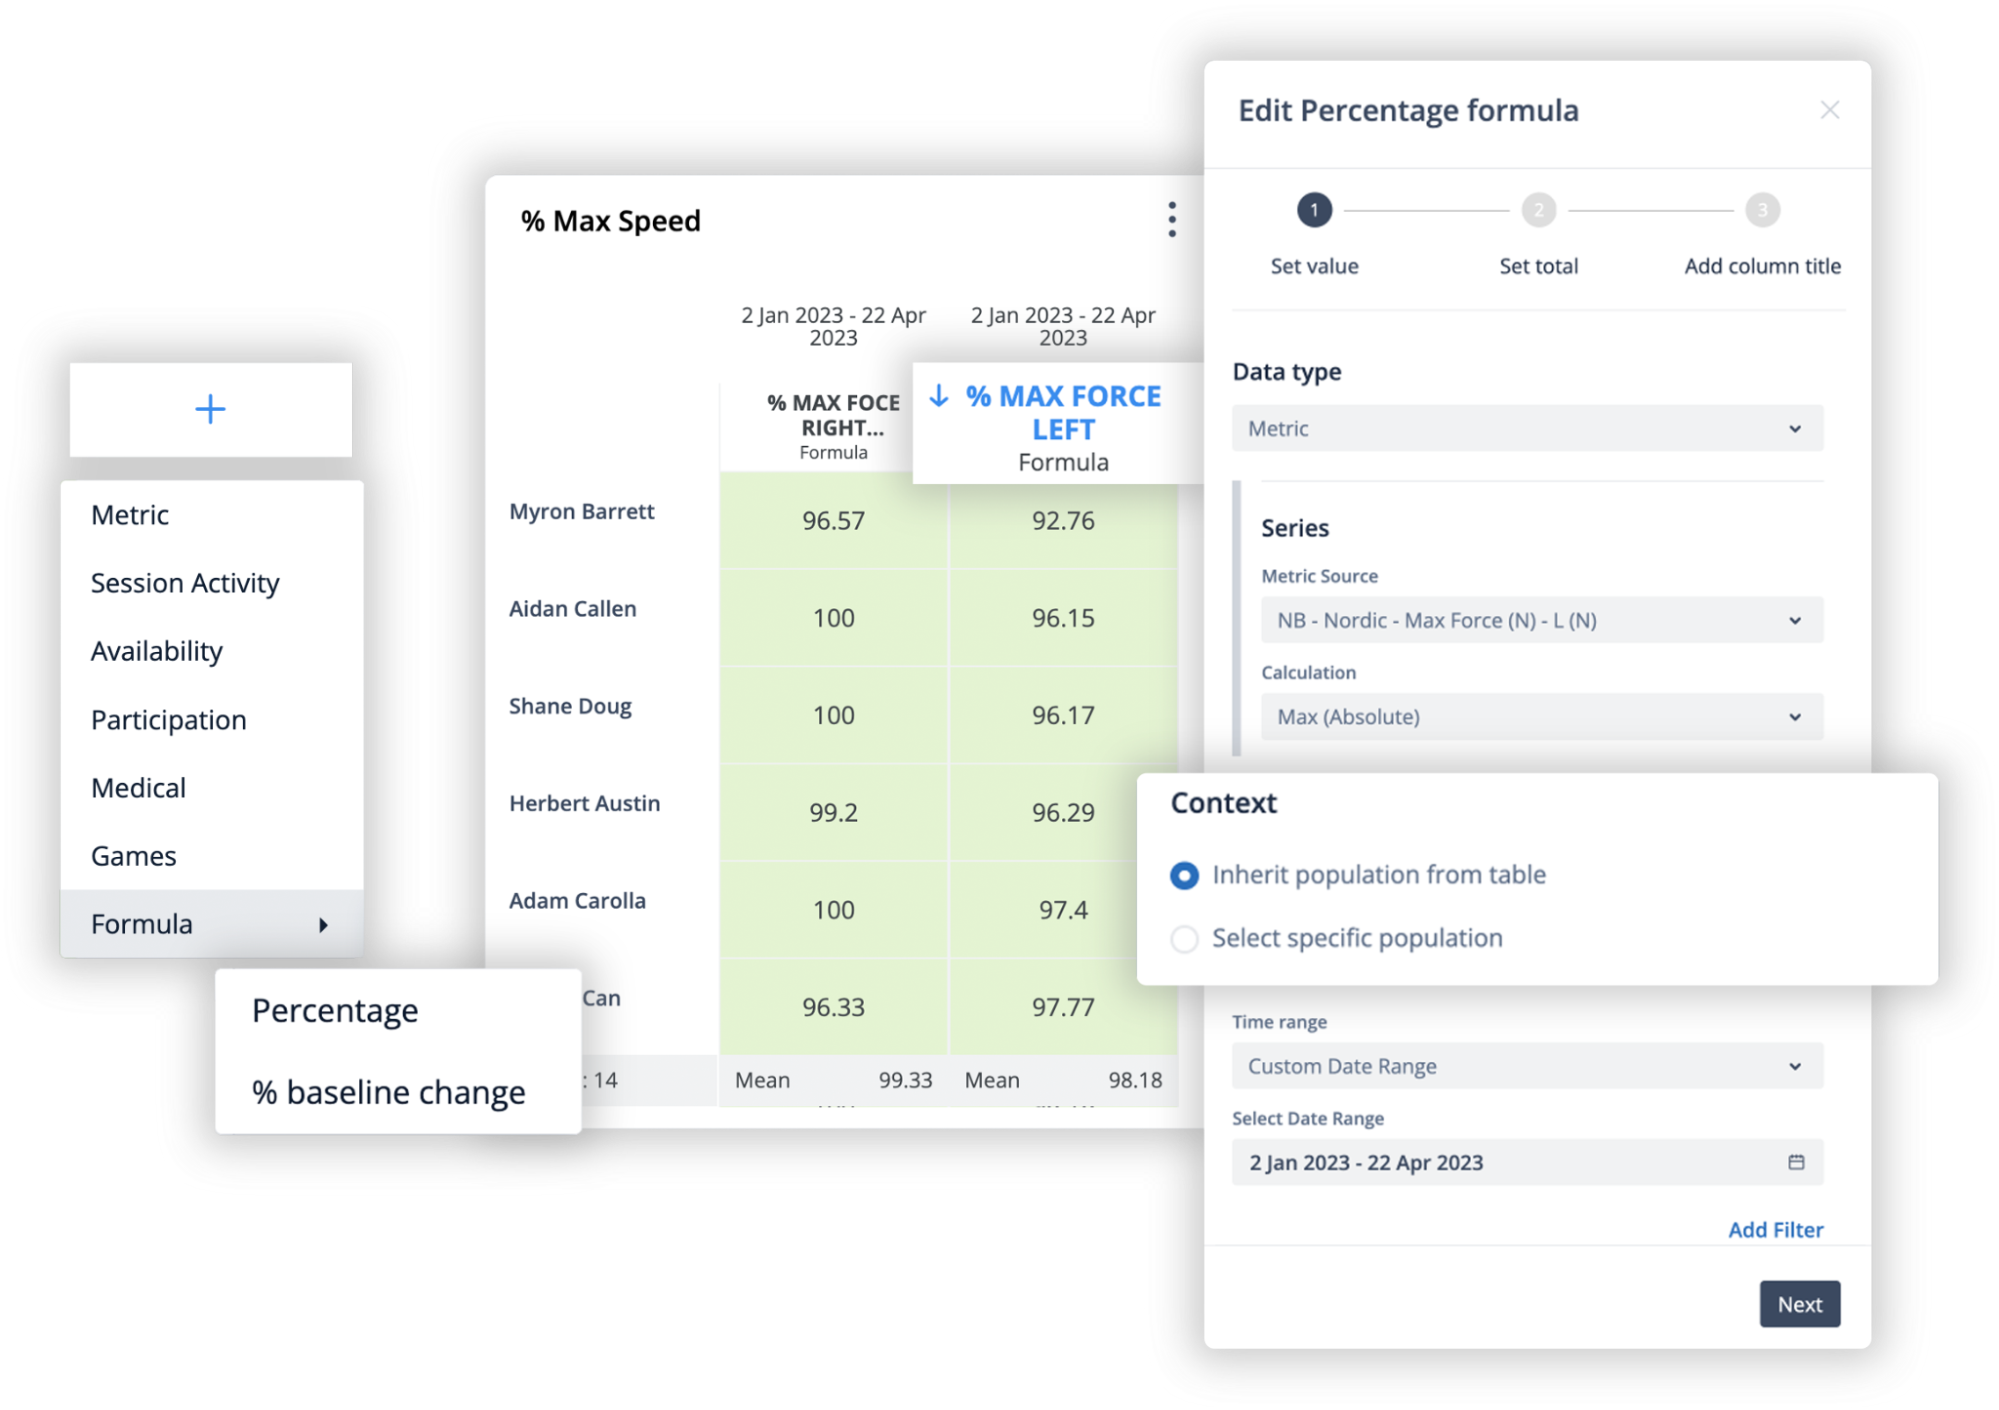
This functionality ensures that users can quickly derive meaningful insights from large datasets, whether they are evaluating squad-wide trends or individual athlete progress.
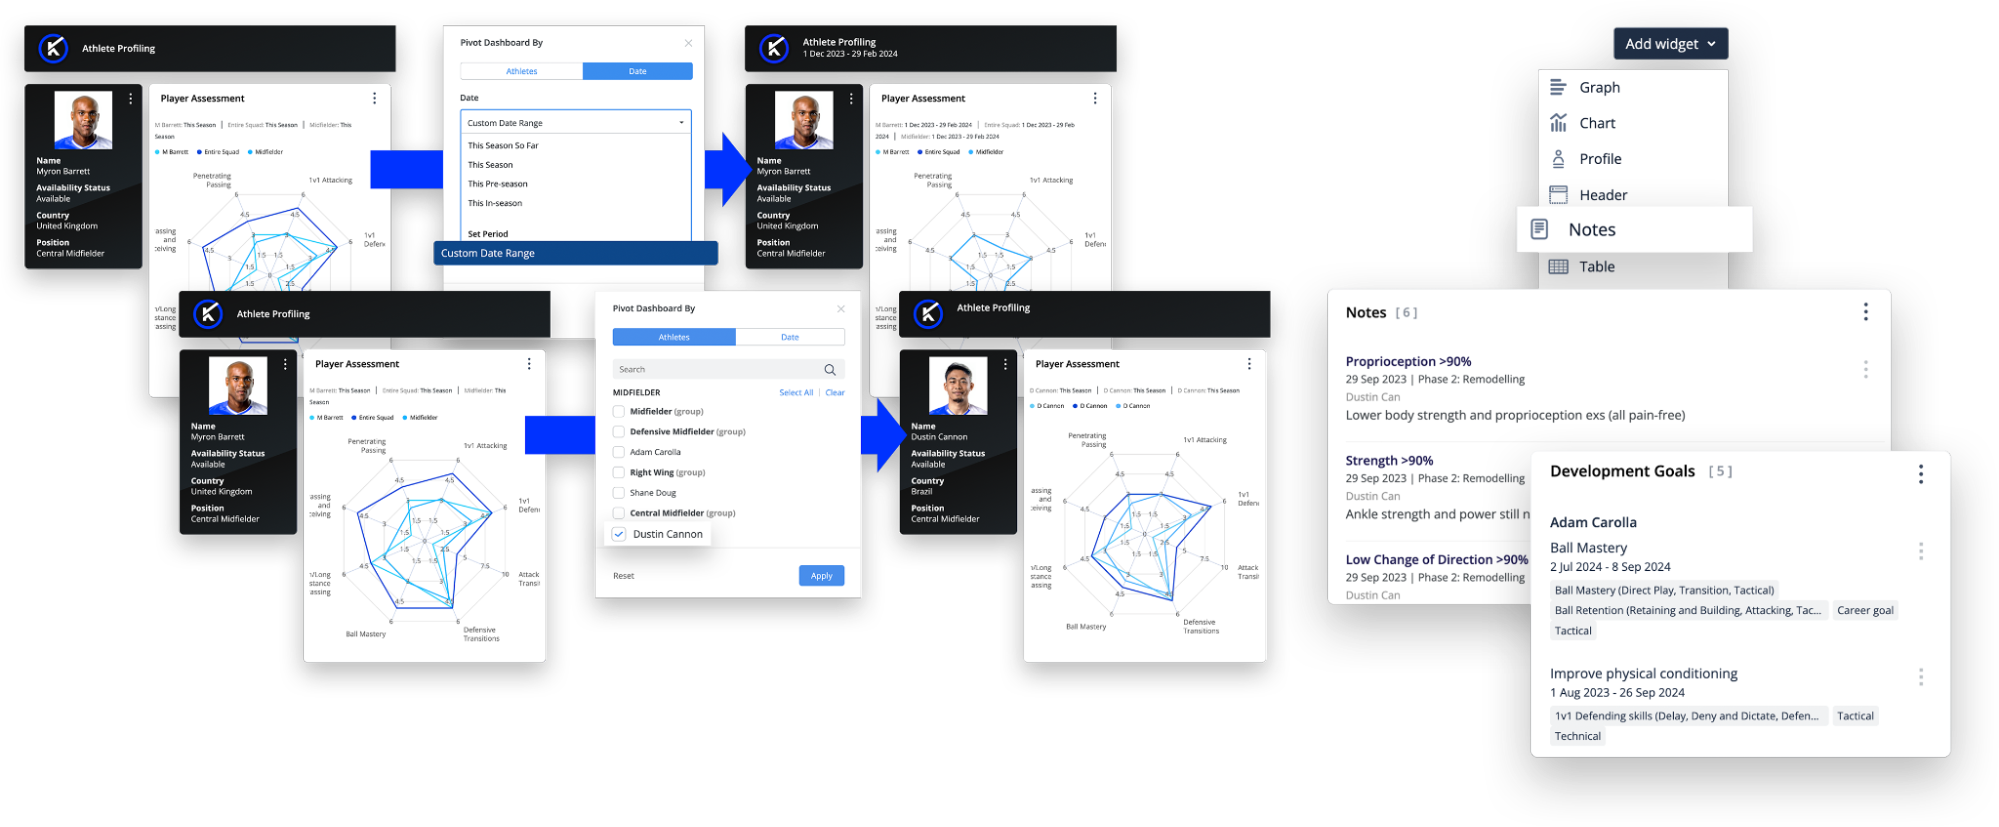
A Fully Customizable Reporting Experience
Beyond visualizations and calculations, iP’s self-service reporting offers additional customization features that enhance usability and adaptability:
- Pivot Functionality – Quickly adjust dashboards to view different athletes, groups, or date ranges in just a few clicks.
- Notes Widgets – Add context to data with notes linked directly to athletes, helping track progress in areas like player development and return to play.
- Linked Dashboards – Navigate seamlessly between dashboards to access deeper insights on a specific athlete, group, or team.
- Event-Specific Reporting – Customize reports for different game scenarios, training sessions, or injury recovery periods.