Not every user needs to build dashboards. Most should not have to.
For coaches, practitioners, and leadership teams, the value of My iP is immediate access to dashboards they can use in their day-to-day work—open, review, schedule, share, act.
Creator Mode in My iP serves a different audience. It is built for the data scientists, analysts, sport scientists, and reporting owners responsible for shaping the data experience behind everyday use.
These users are not just consuming insight. They are shaping how insight moves through the organization.
Sports BI Built Around the Way Teams Work
Traditional business intelligence platforms can help organizations visualize data. But sport has its own data structures, workflows, and decisions.
Teams need to understand athlete health, availability, performance trends, training demands, development pathways, and operational priorities. They need dashboards that reflect how practitioners work, how coaches consume information, and how leadership evaluates progress.
Creator Mode brings Sports BI capabilities into My iP, giving designated users the flexibility to create dashboards and reports around the realities of sport—built on top of a consistent data foundation.
This is not generic dashboard creation. It is reporting built around how sports organizations work.
What Creators Can Build in My iP
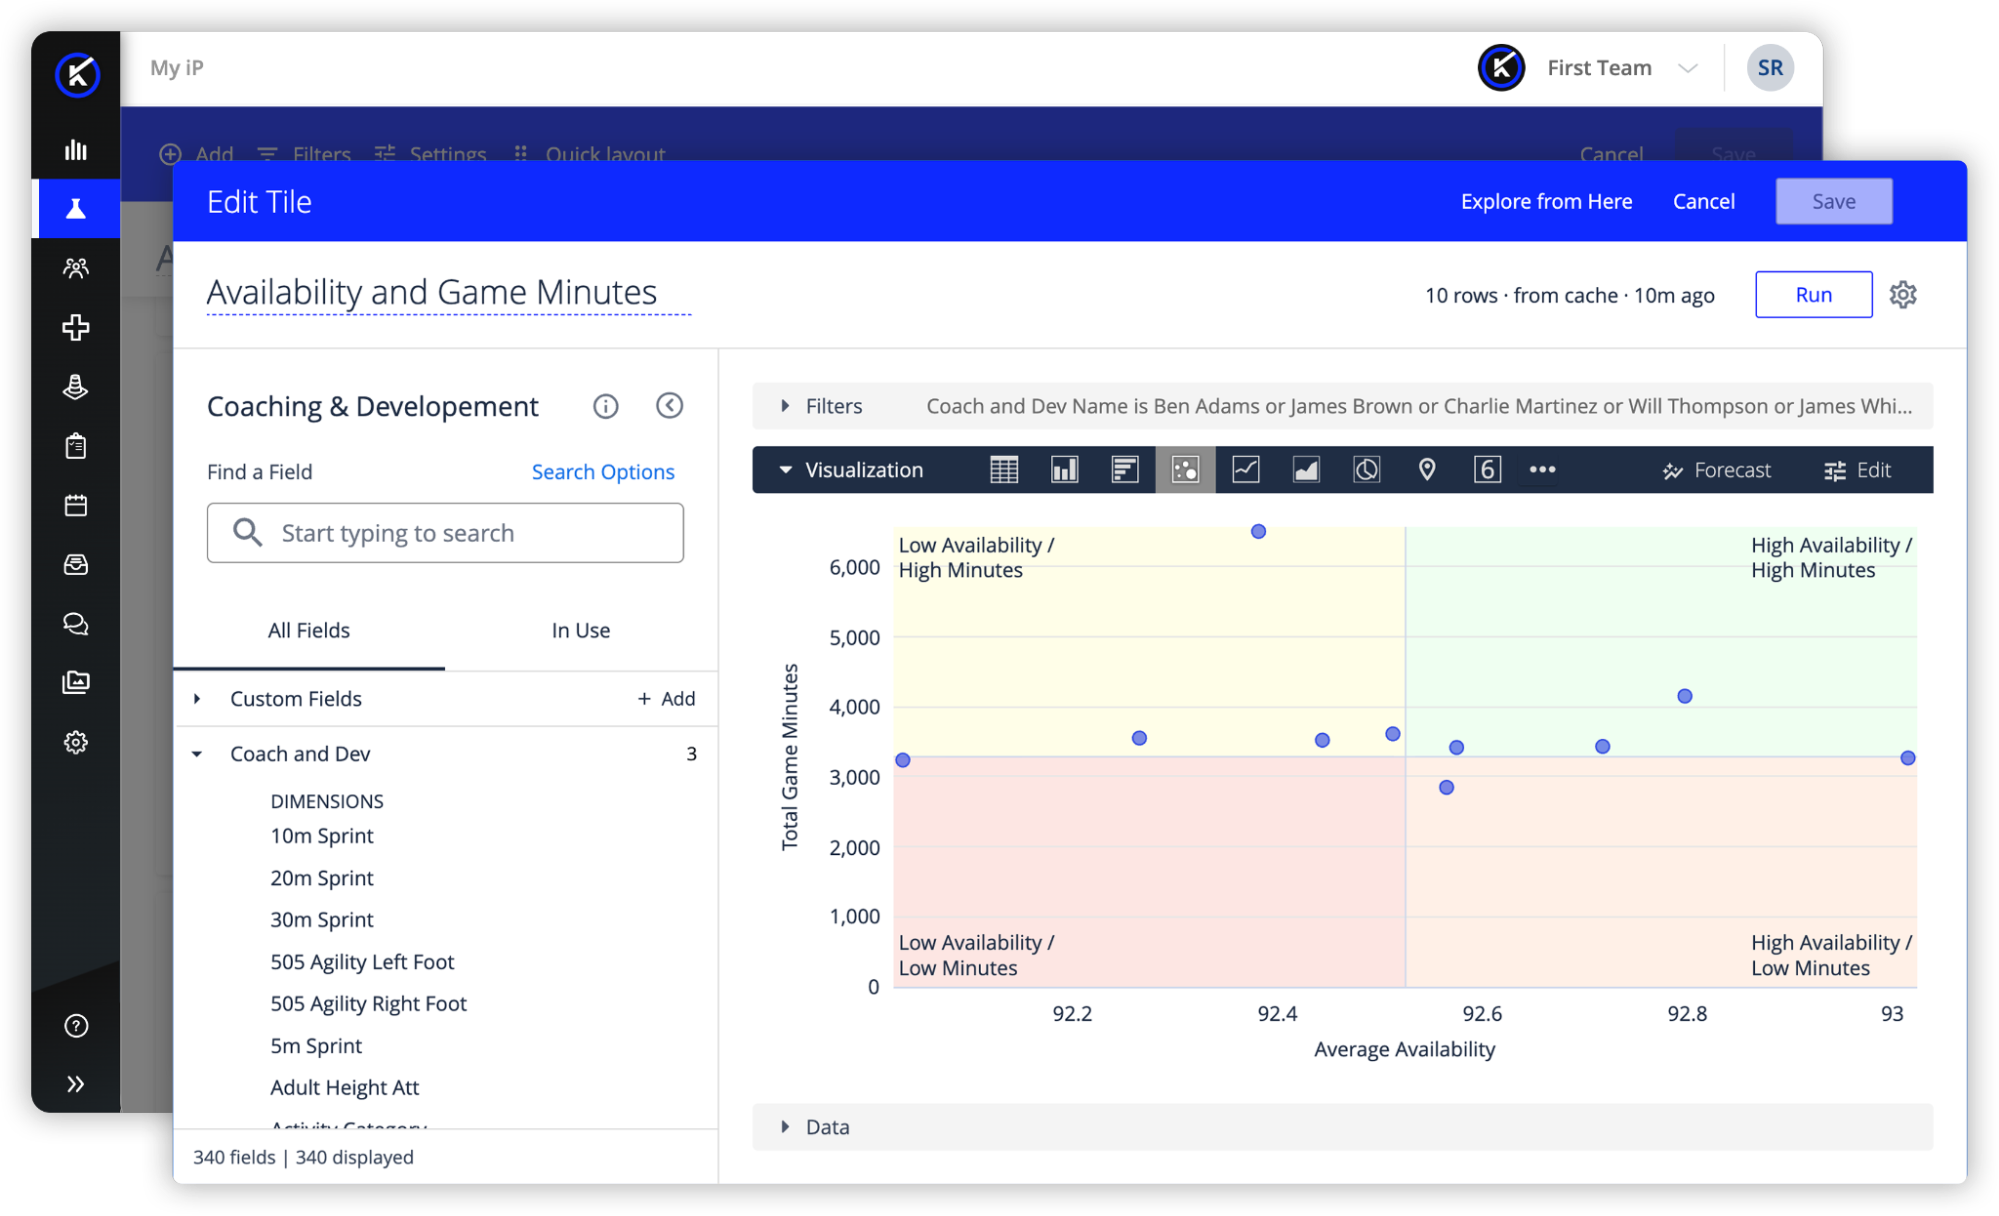
Creator Mode gives designated users a structured workspace for analysis and reporting. It is not about rebuilding the data layer or writing code. It is about working with curated, organization-specific data to create dashboards, reports, and views that answer more specific questions.
Inside Creator Mode, Creators can:
- Create custom metrics and groupings. Using fields available within the selected dataset, Creators can build custom dimensions and measures through a no-code expression editor—for example, grouping training sessions by intensity band, classifying injuries by mechanism, or creating a filtered measure for soft-tissue injuries within a defined period.
- Apply analytical logic to results. Use table calculations to support running totals, period-over-period change, rankings, percentage comparisons, and offset calculations.
- Pivot, compare, and segment data. Compare positions across weeks, exposure types across squads, or recovery markers across phases of a season. Apply custom filters to focus on the population, timeframe, or scenario that matters.
- Build visualizations around the question. Create line, bar, stacked, scatter, and table visualizations with control over axes, series, and formatting.
- Save, organize, and share reporting assets. Save dashboards and reports as reusable assets, organize them across shared and personal folders, and make them available for others to use, copy, or adapt where appropriate.
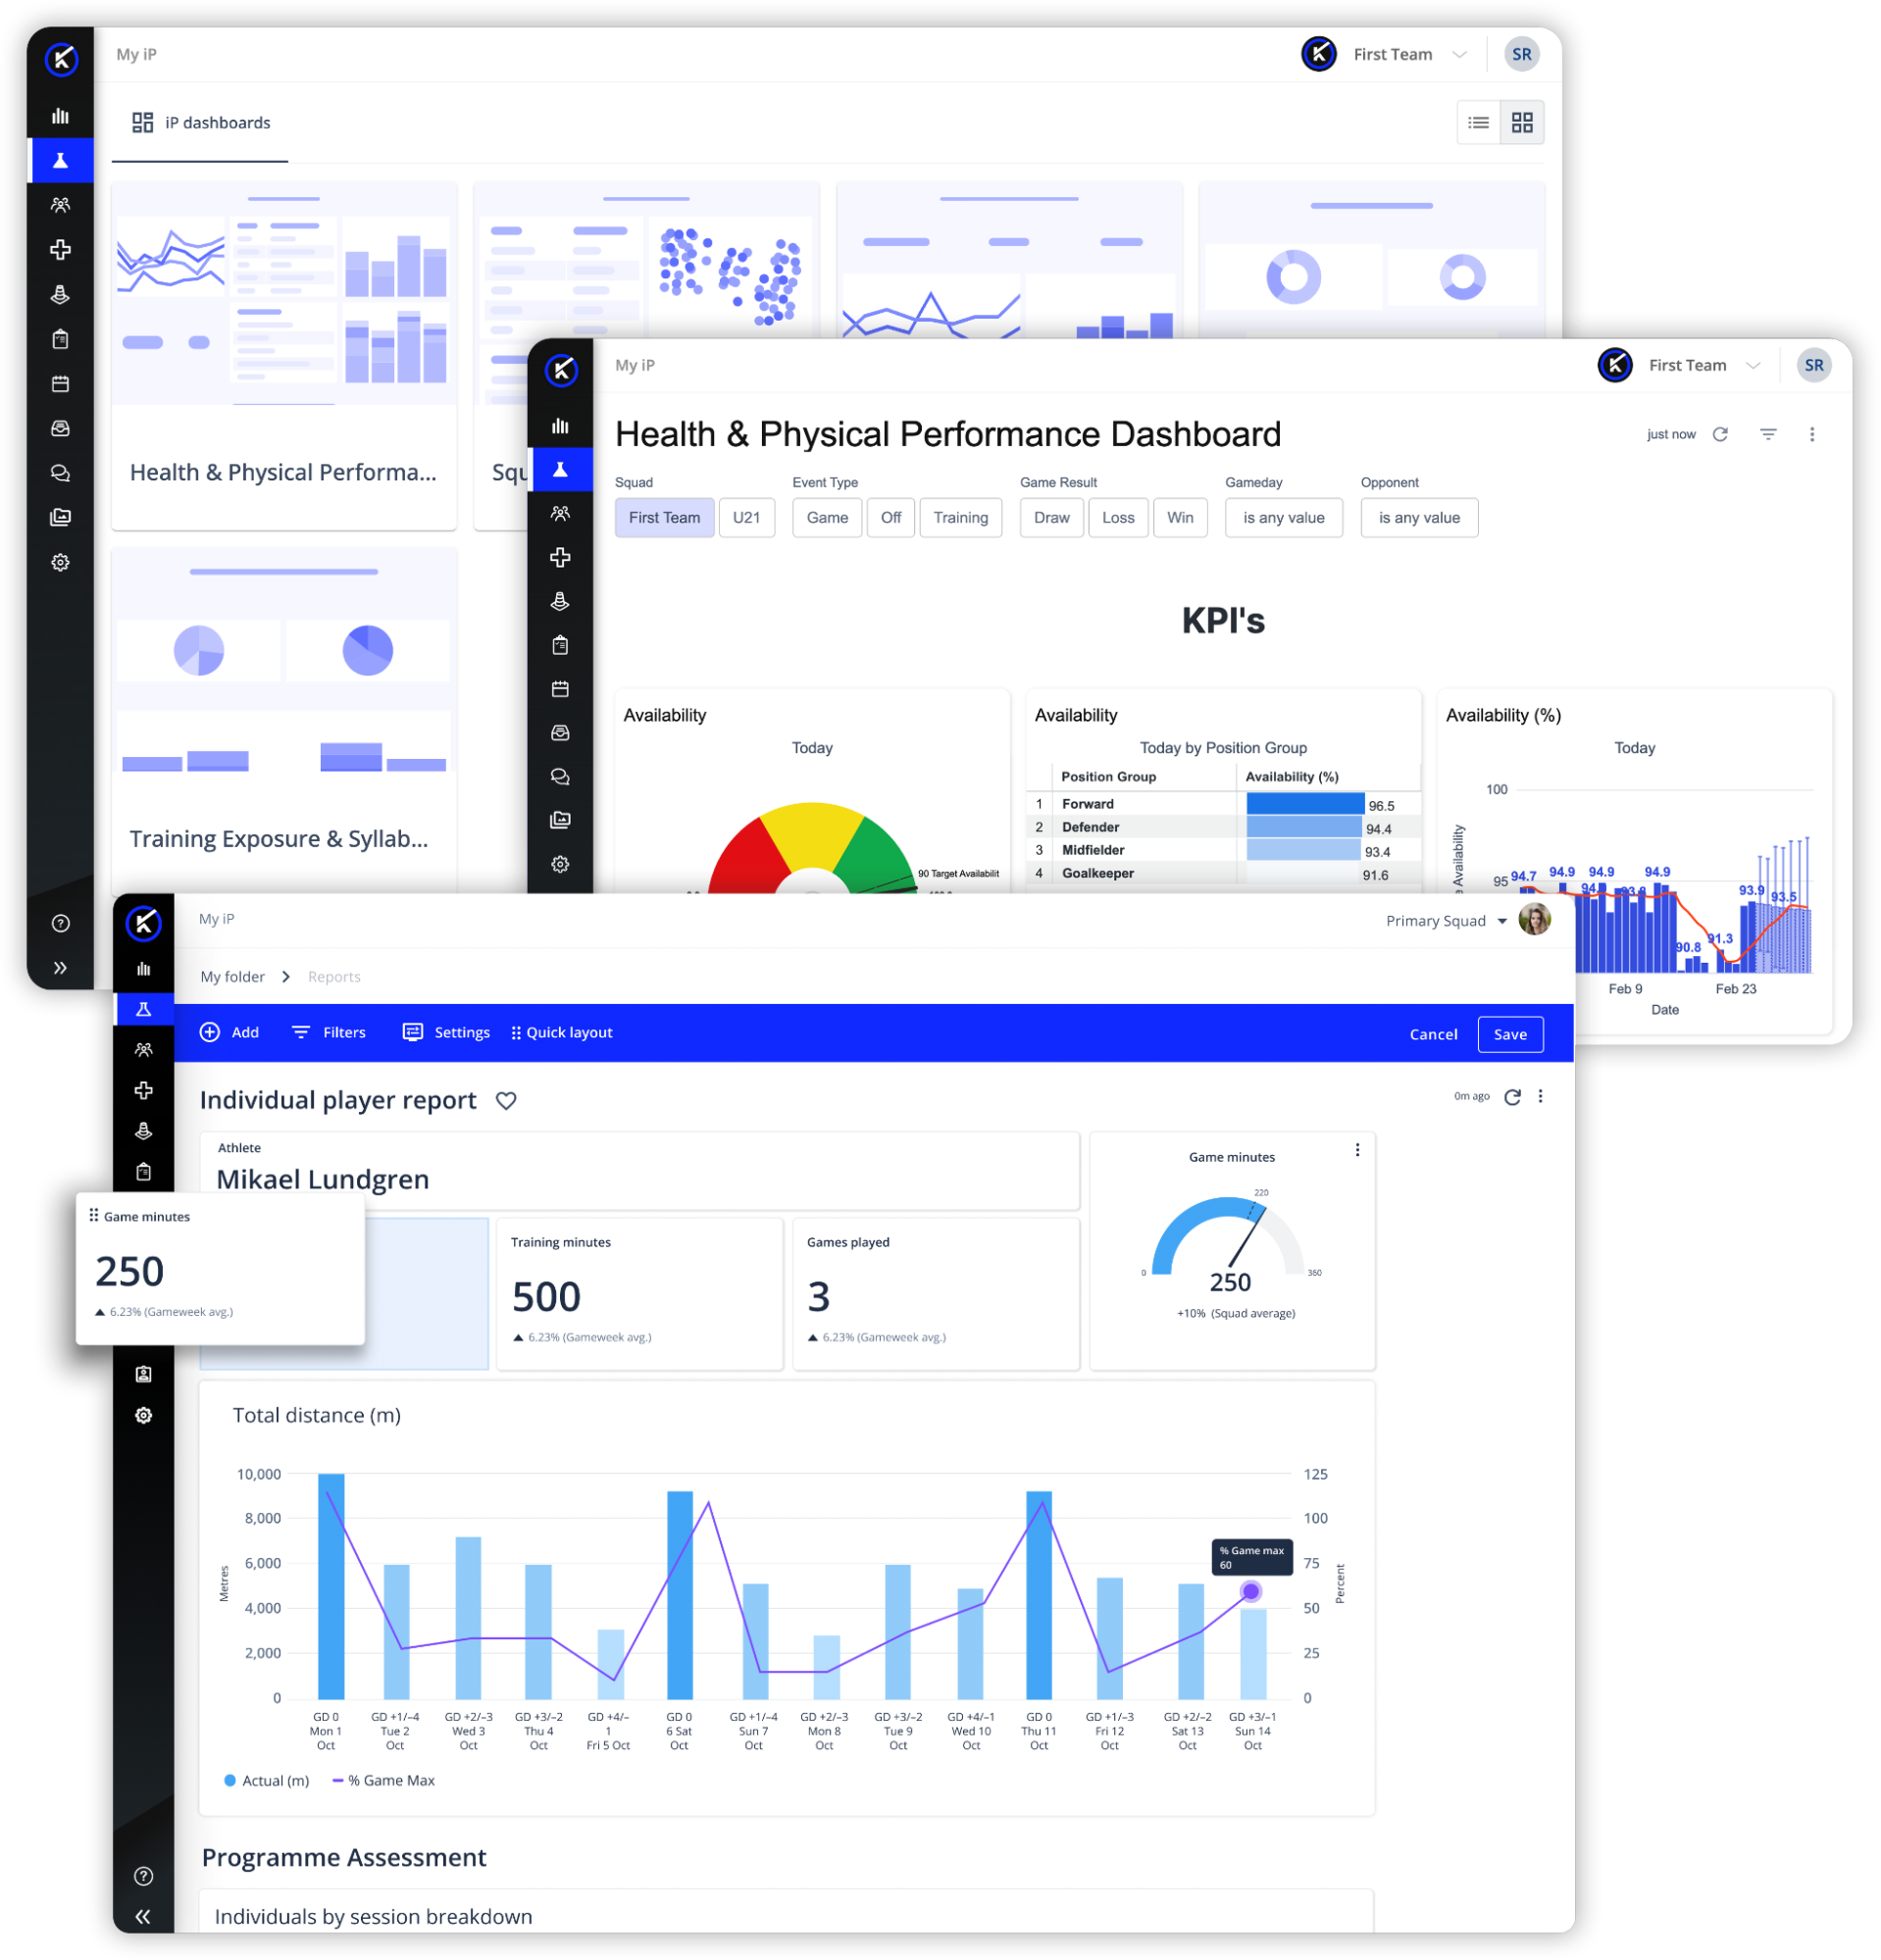
Creator Mode gives power users the flexibility to build on top of a consistent data foundation. That foundation—the metrics, definitions, integrations, and data health checks that keep information aligned across the organization—is maintained inside My iP.
Creators do not have to export data into spreadsheets, rebuild logic in separate BI tools, or stitch reports together across disconnected systems. Reporting is shaped where the data lives. That is what keeps it tailored to each team and aligned across the organization.
From Standard Dashboards to Organization-Specific Reporting
Two teams may track similar data, but their reporting needs are rarely identical.
Standard dashboards help teams get value quickly. Creator Mode lets designated users go further—moving beyond standard reporting to create dashboards that answer more specific questions, support internal workflows, and reflect how their organization actually reviews information.
What that looks like in practice:
- Medical teams build dashboards focused on injury trends, athlete availability, and return to play progress.
- Performance teams build reports around load, readiness, and training response.
- Department leads create recurring views that standardize how information is reviewed each week.
- Leadership gets simplified dashboards that bring key signals together for strategic conversations.
Creator Mode delivers those experiences inside My iP—without forcing every user to become a dashboard builder.
Create From Scratch. Adapt What Already Exists.
Creator Mode is not only about starting from a blank page.
My iP includes pre-configured and configurable dashboards designed to deliver value quickly. These give Viewers clear, relevant insight without requiring them to build anything. For more on how Viewer and Creator experiences work together, see Viewers and Creators in My iP: The Right Data Experience for Every User.
Creator Mode adds another layer.
A Creator can copy an existing dashboard and adapt it for a specific use case—changing metrics, adjusting visualizations, refining layouts, applying calculations, or building a new version for a particular department or workflow.
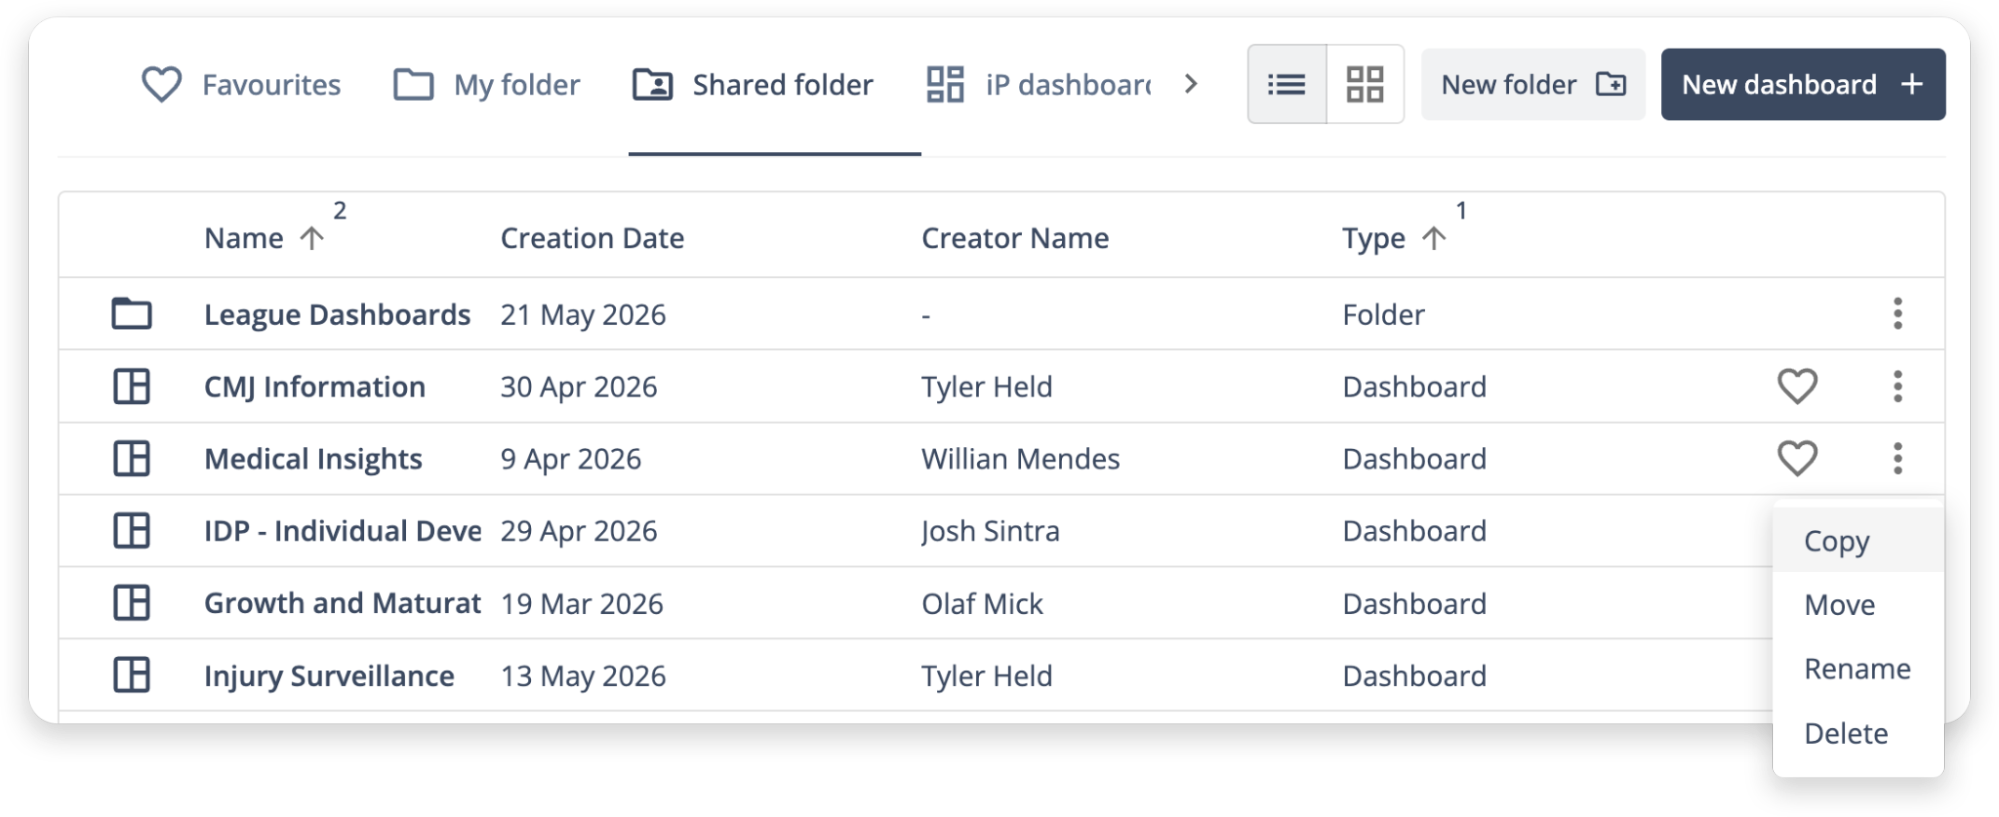
That gives organizations the right balance: immediate value for everyday users, and deeper reporting control for the power users responsible for shaping how data is used across teams.
Better Reporting Across the Organization
Dashboards and reports are not just outputs. They shape how teams communicate, align, and act.
When reporting is fragmented, departments interpret information differently. When it is too rigid, teams struggle with new questions. When it is too technical, the people who need the insight do not use it.
Creator Mode helps organizations build a more connected reporting model.
Designated users develop reporting aligned to specific workflows, roles, and decisions—supporting different audiences without forcing every user into the same view. Medical teams, performance teams, coaching staff, and leadership each work from reporting that reflects their needs while staying connected to the same data foundation.
The result is not just more dashboards. It is reporting that:
- Reflects how the organization actually operates
- Can be reused and refined across teams
- Helps move information from availability to usability