My iP is a new intelligence layer within iP: Intelligence Platform, designed to strengthen how teams report on, visualize, and work with their data. Moving reporting beyond static outputs brings more flexible, explorable insight into daily workflows.
Performance Management Dashboards are one of the first expressions of that approach. Built for workload reporting, these dashboards use structured data already within iP to give performance teams faster, clearer insight into training load, game context, and the microcycle—while laying the foundation for broader self-service reporting capabilities over time.
Performance Management Dashboards: The First Release Within My iP
Performance teams already work with workload data every day, but too often that data lives in static reports or rigid views that make it hard to answer practical questions quickly.
Understanding where load comes from, how training aligns with game demands, and how exposure accumulates across the microcycle—relative to game context and fixture spacing—can still require manual analysis, exports, or report rebuilds—slowing planning, review, and communication.
Performance Management Dashboards are designed to remove that friction.
They give performance teams a faster, clearer way to understand workload across sessions, drills, players, and the microcycle, with readiness and training context viewed alongside physical load.
Instead of static reports, teams can quickly answer the questions that matter most:
- How did today’s session compare to game load and intensity?
- Where did load actually come from within the session?
- How does training exposure align with player readiness across the microcycle?
With Performance Management Dashboards in My iP, performance staff can work with workload data dynamically, filtering by context, drilling into detail, and moving seamlessly from squad-level trends to individual insights, without exporting, using spreadsheets, or rebuilding reports.
From Static Reports to Flexible Workload Reporting
Traditional reporting has focused on capturing what happened through fixed views that are slow to adapt as questions change.
Performance Management Dashboards enhance the experience by making reporting explorable and responsive to context, without changing the underlying data that teams already trust.
Sessions, games, drills, and athletes are brought into a single, connected view, allowing teams to filter, compare, and drill into workload from multiple angles as questions arise, without merging datasets or creating new reports.
Reporting becomes easier to adapt in the moment, whether teams are reviewing what just happened or checking how a session fits within the broader microcycle.
Dashboards support both pre-session planning and post-session review, helping teams validate whether training delivered the intended stimulus across the microcycle.
Built for How Performance Teams Actually Work
Performance Management Dashboards within My iP are purpose-built for workload estimation, planning, and reporting—designed around the questions performance coaches and sports scientists ask every day.
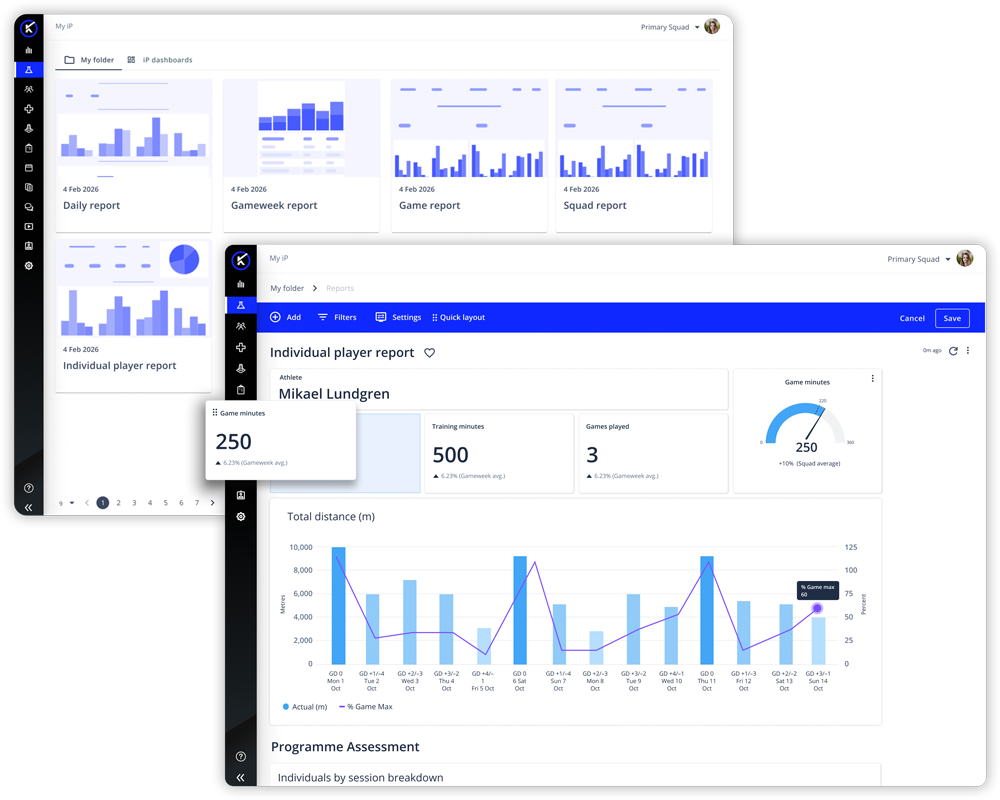
The dashboards support multiple views, including:
- Daily Analysis
- Gameweek Analysis
- Game Analysis
- Player Analysis
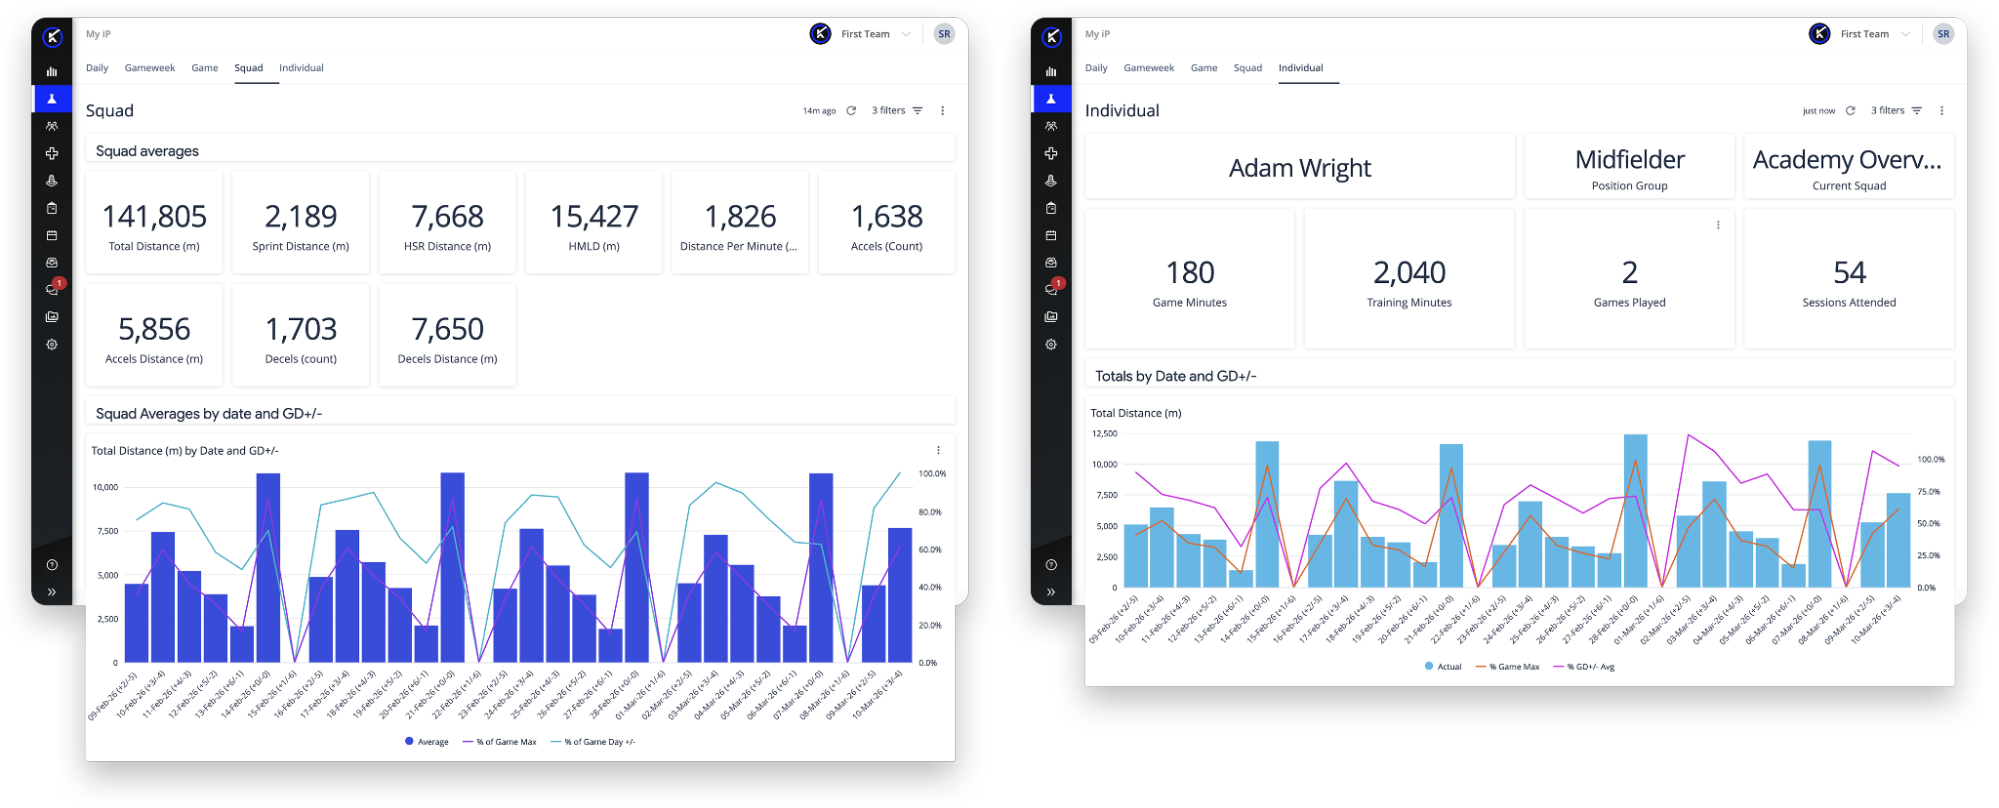
- Squad Analysis
Each view is connected and explorable, allowing teams to move seamlessly from squad-level trends to drill-level detail—without switching tools or exporting data.
One Unified View of Performance Data
Effective workload reporting depends on context.
Performance Management Dashboards bring together workload, readiness indicators, and training context in a single reporting experience, including:
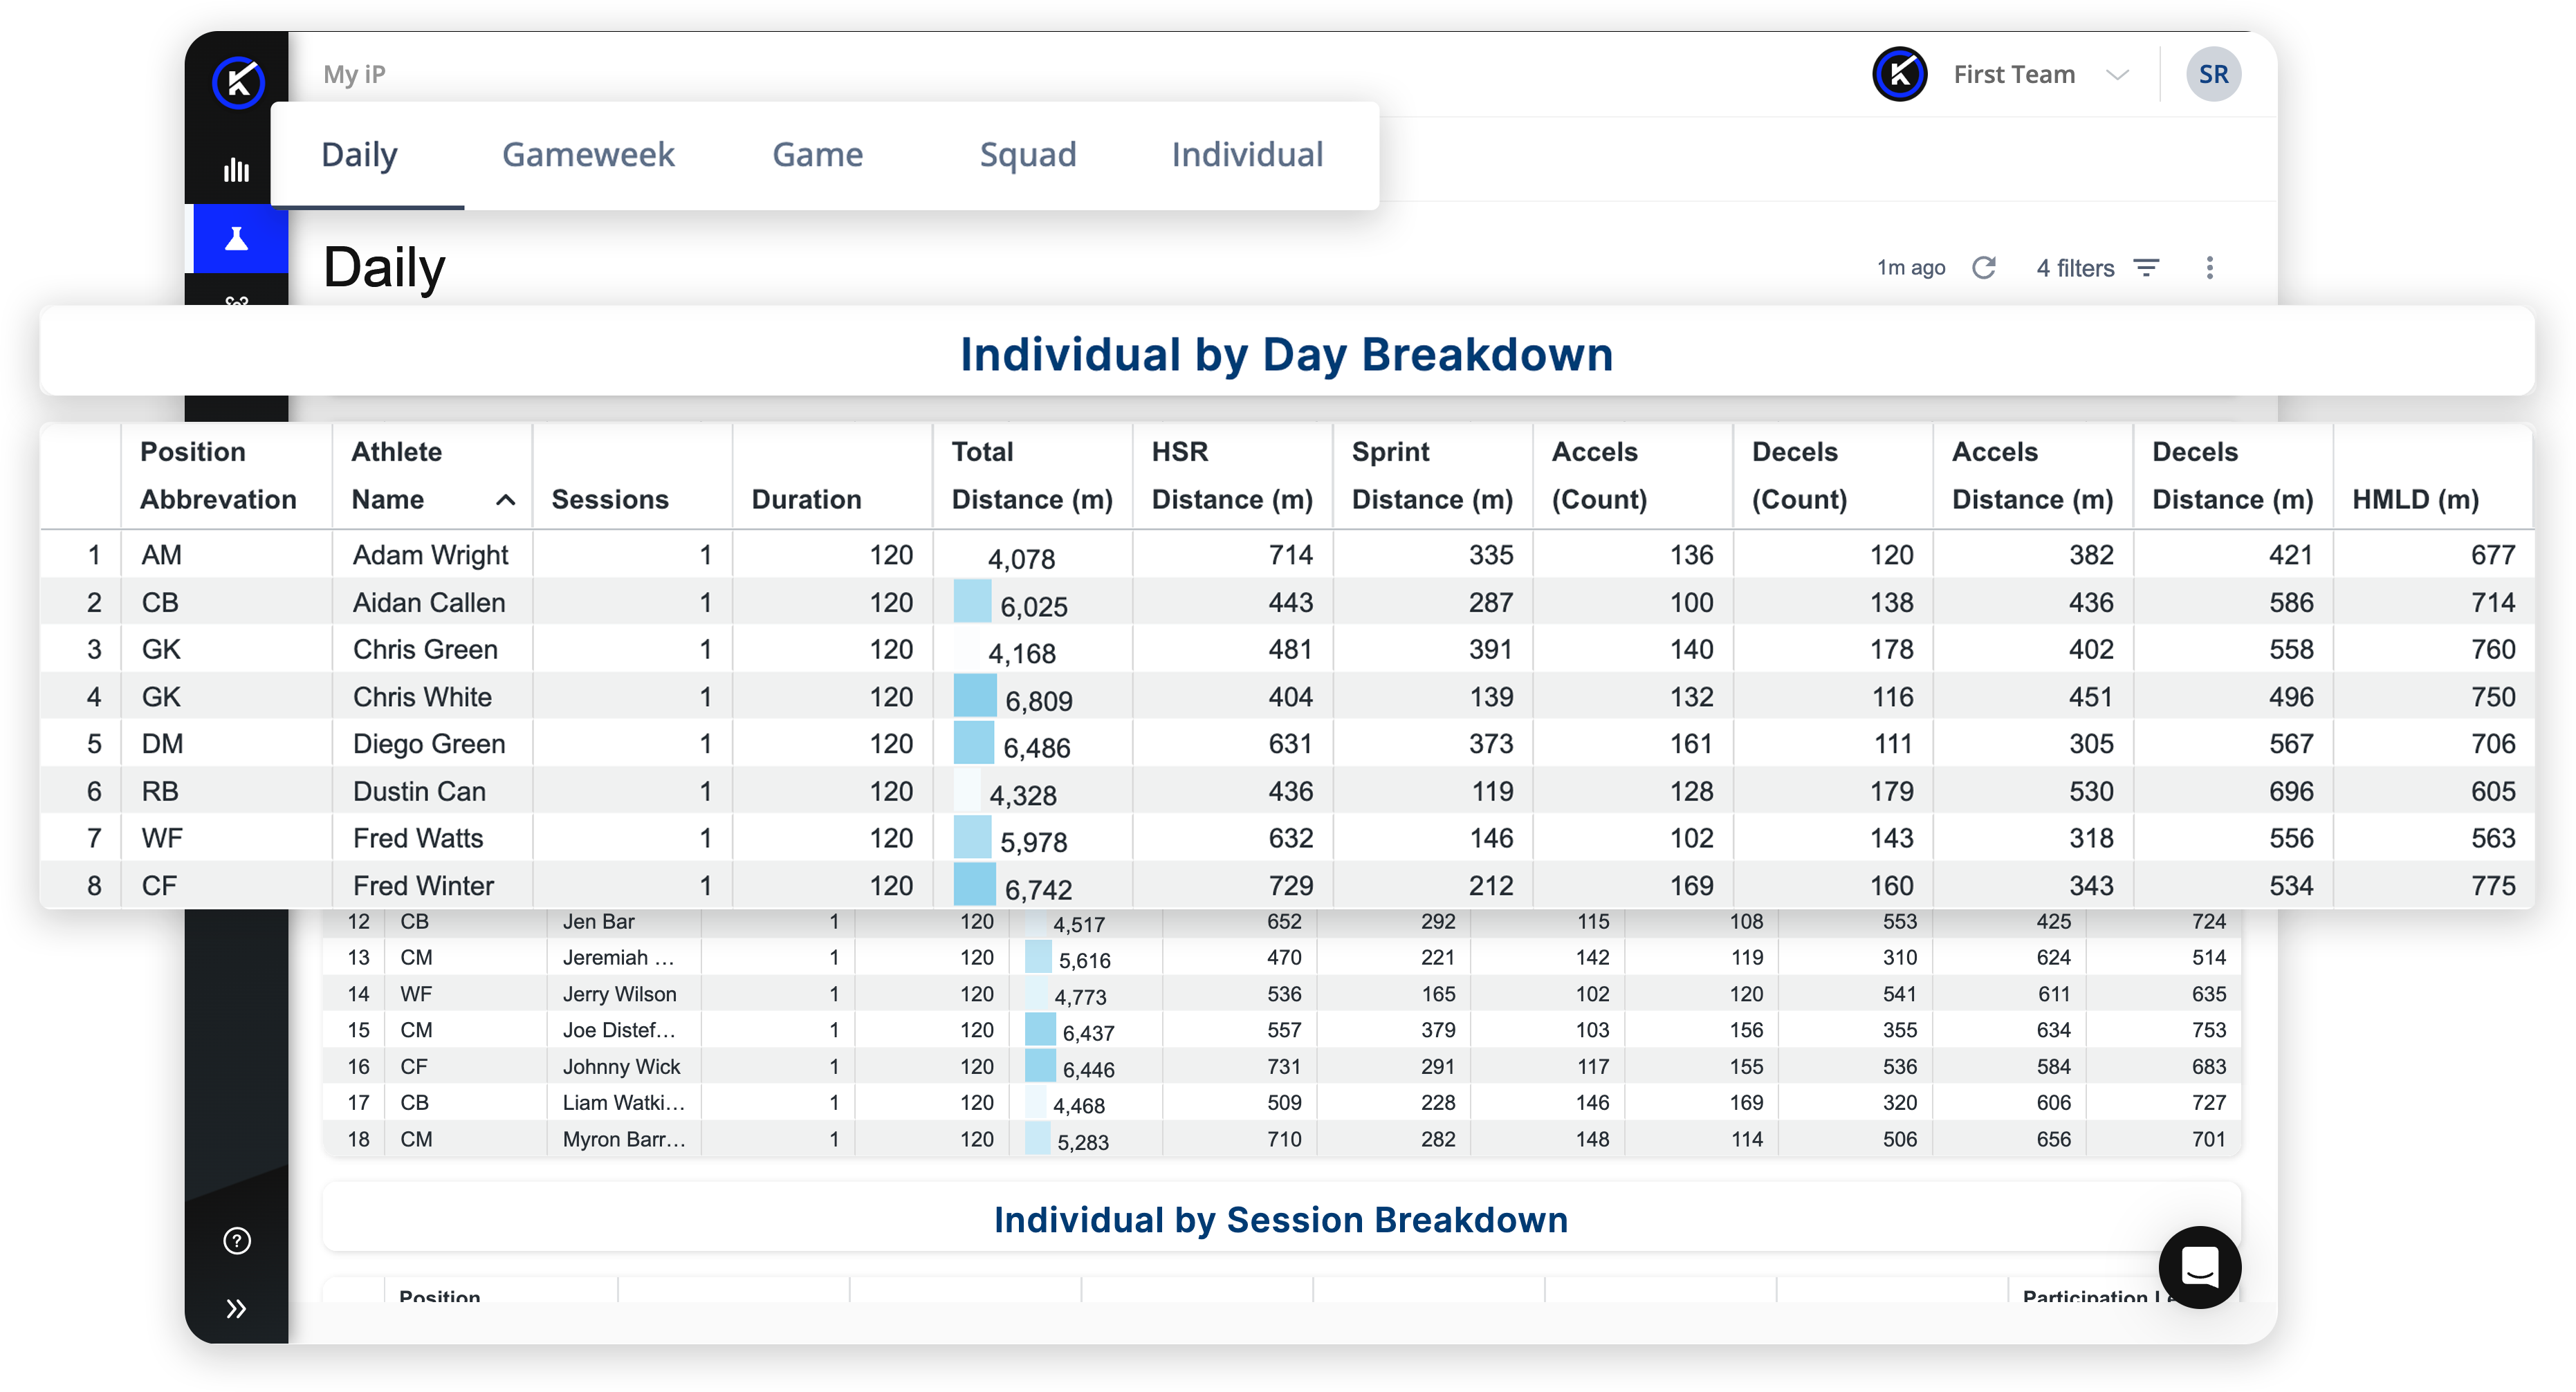
- GPS metrics such as Total Distance, High-Speed Running, Sprint Distance, Accelerations/Decelerations, Velocity, and High Metabolic Load Distance
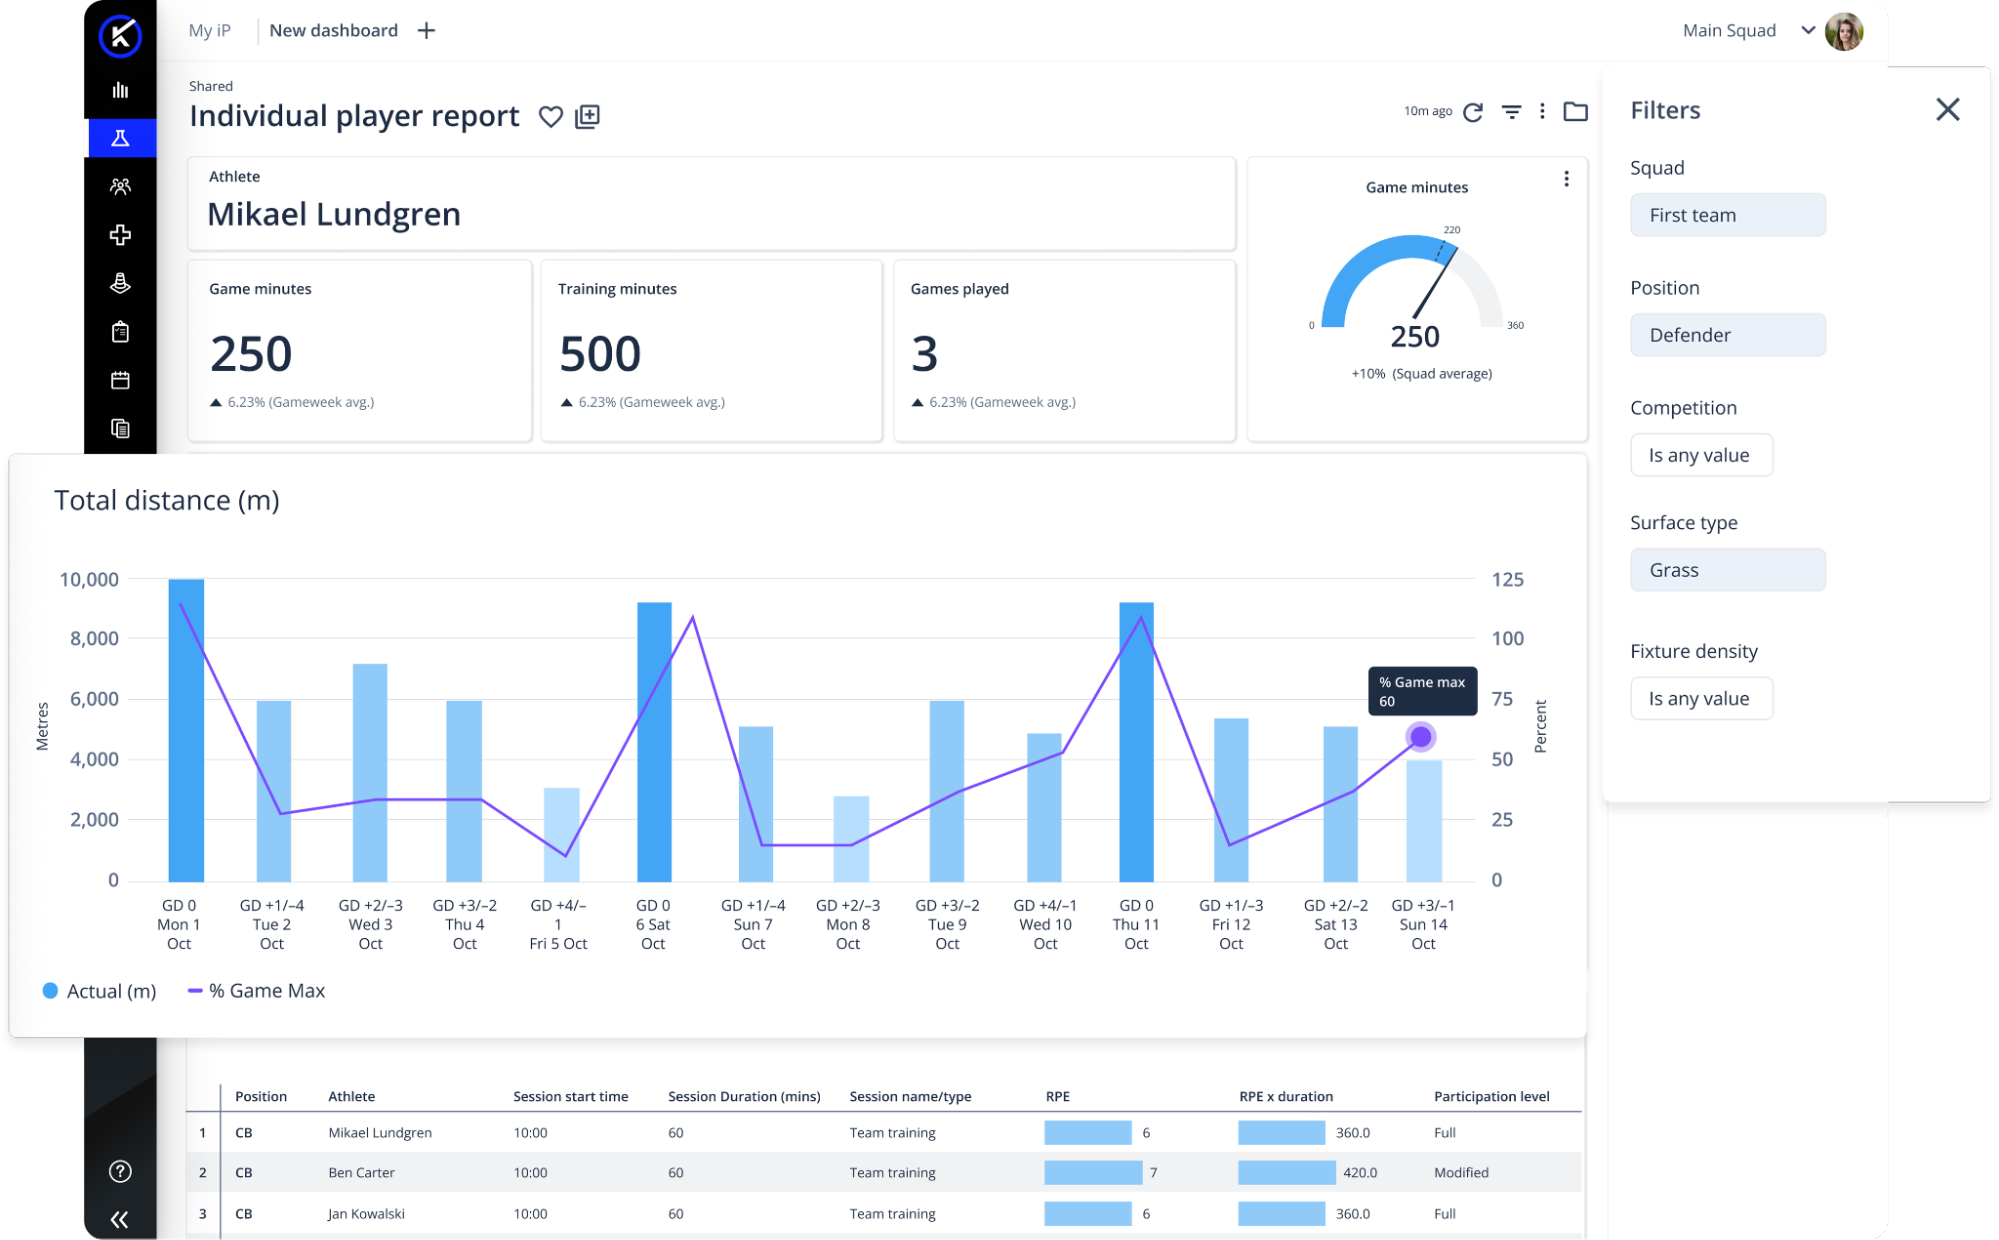
- Post-session and post-game Rating of Perceived Exertion (RPE) data
- Availability status and participation context
- Testing data such as Countermovement Jump (CMJ)
- Session and drill metadata that adds essential training context
With data unified within iP, teams no longer need to reconcile multiple systems to understand workload. Everything is already aligned and ready to explore.
True Self-Service, Without the Friction
Self-Service Reporting isn’t just about flexibility—it’s about speed and confidence.
With the Performance Management Dashboards, users can:
- Filter and group data by games, sessions, drills, squads (squad ownership of the data), position groups, roles, or individuals
- Pivot views instantly without rebuilding reports
- Drill down from squad trends to individual sessions in a few clicks
- Export and print dashboards for clear communication with coaches and leadership
All of this happens directly within iP—no external tools, no additional logins, and no reliance on analysts for day-to-day reporting.
Turning Insight Into Better Decisions
The real value of reporting isn’t the chart—it’s the decision-making it enables.
By transforming fragmented session data into usable workload intelligence, Performance Management Dashboards help performance teams:
- Make faster, more confident decisions using ready-made, shareable dashboards
- Communicate more clearly with coaches by translating workload into game-ready context
- Act sooner on emerging trends by spotting load patterns across sessions, drills, and gameweeks
Self-Service Reporting in iP turns data into something performance staff can use every day—not just review after the fact.
From Session Data To Smarter Decisions.
Performance Management Dashboards represent a meaningful evolution in how performance teams interact with workload data—bringing drill-level insight, game context, and periodisation support into a single reporting experience.
Performance Management Dashboards are available to teams with the Performance Optimization Solution enabled in iP.
Contact us to explore Self-Service Reporting in iP: Intelligence Platform—and see how Performance Management Dashboards support smarter workload decisions across training and match days.