Injury review should not depend on rebuilding reports every time a question changes.
Medical teams need to understand more than how many injuries occurred. They need to see which injuries created the greatest burden, where patterns are emerging, how rates compare across seasons or subgroups, and whether time-loss is being driven by specific body areas, classifications, exposure types, or periods of the calendar.
When that information has to be compiled manually, injury review becomes slower, less consistent, and harder to use in planning conversations.
The Injury Review Dashboard in My iP is designed to change that.
Available to organizations with the Performance Medicine Solution enabled in iP: Intelligence Platform, it gives medical teams and the performance staff who support injury review and prevention planning a standardized self-service reporting view of the team’s injury profile across seasons.
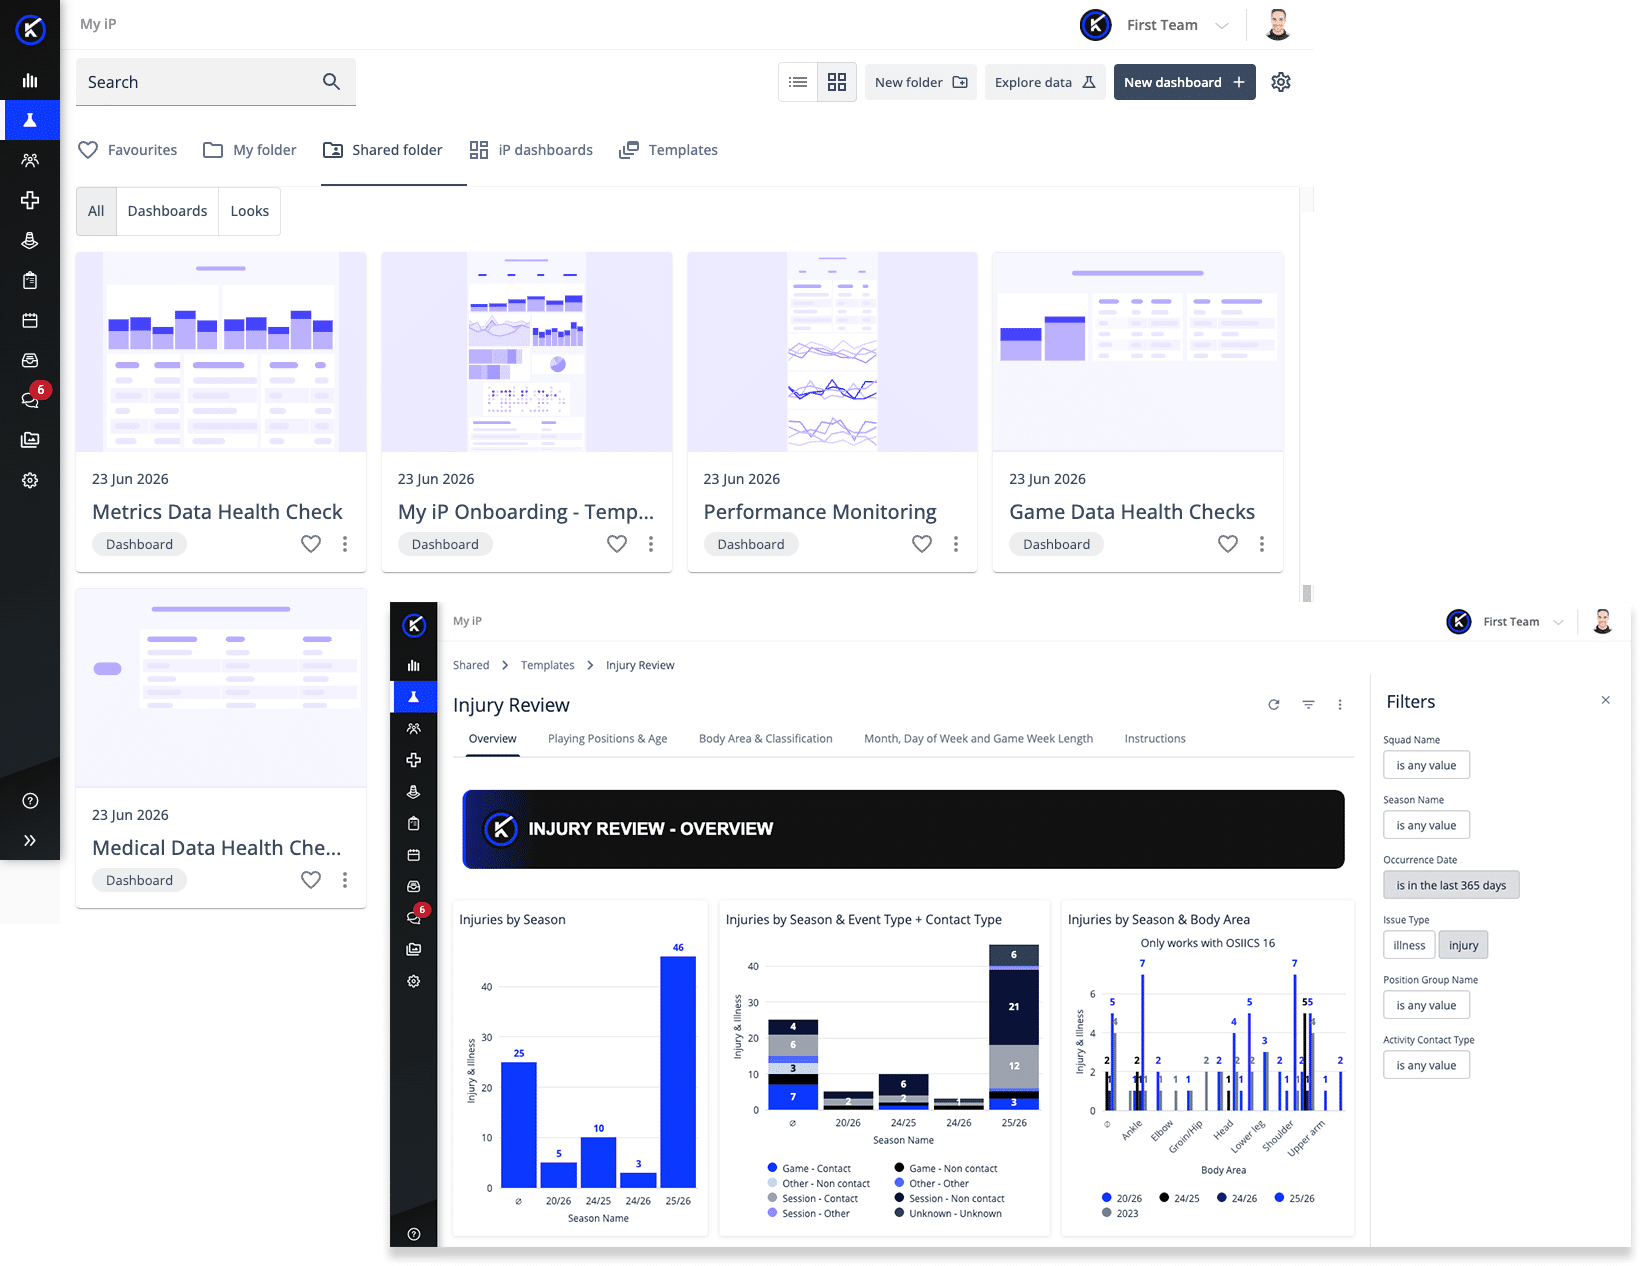
Why Injury Review Still Takes Too Much Time
Injury review is rarely just about counting cases. It is about understanding patterns across timing, exposure, severity, and context.
When that work depends on manually rebuilding reports across injury records, exposure data, clinical classifications, and seasonal comparisons, teams face familiar challenges:
- Injury counts are easier to see than injury impact
- Time-loss and burden are difficult to compare consistently
- Position, age, body area, classification, and exposure patterns require manual analysis
- End-of-block and end-of-season reporting takes time away from planning and decision-making
The result is reporting overhead at the exact moment medical teams need clarity.
A Self-Service Reporting View Built for Injury Review
The Injury Review Dashboard is part of the self-service reporting experience in My iP. It gives teams a ready-to-use starting point for injury review, with the flexibility to copy and personalize the shared template around their workflow, reporting needs, and review priorities.
It brings key injury measures into one place, helping medical teams review incidence, burden, time-loss, exposure-adjusted rates, and injury patterns more consistently.
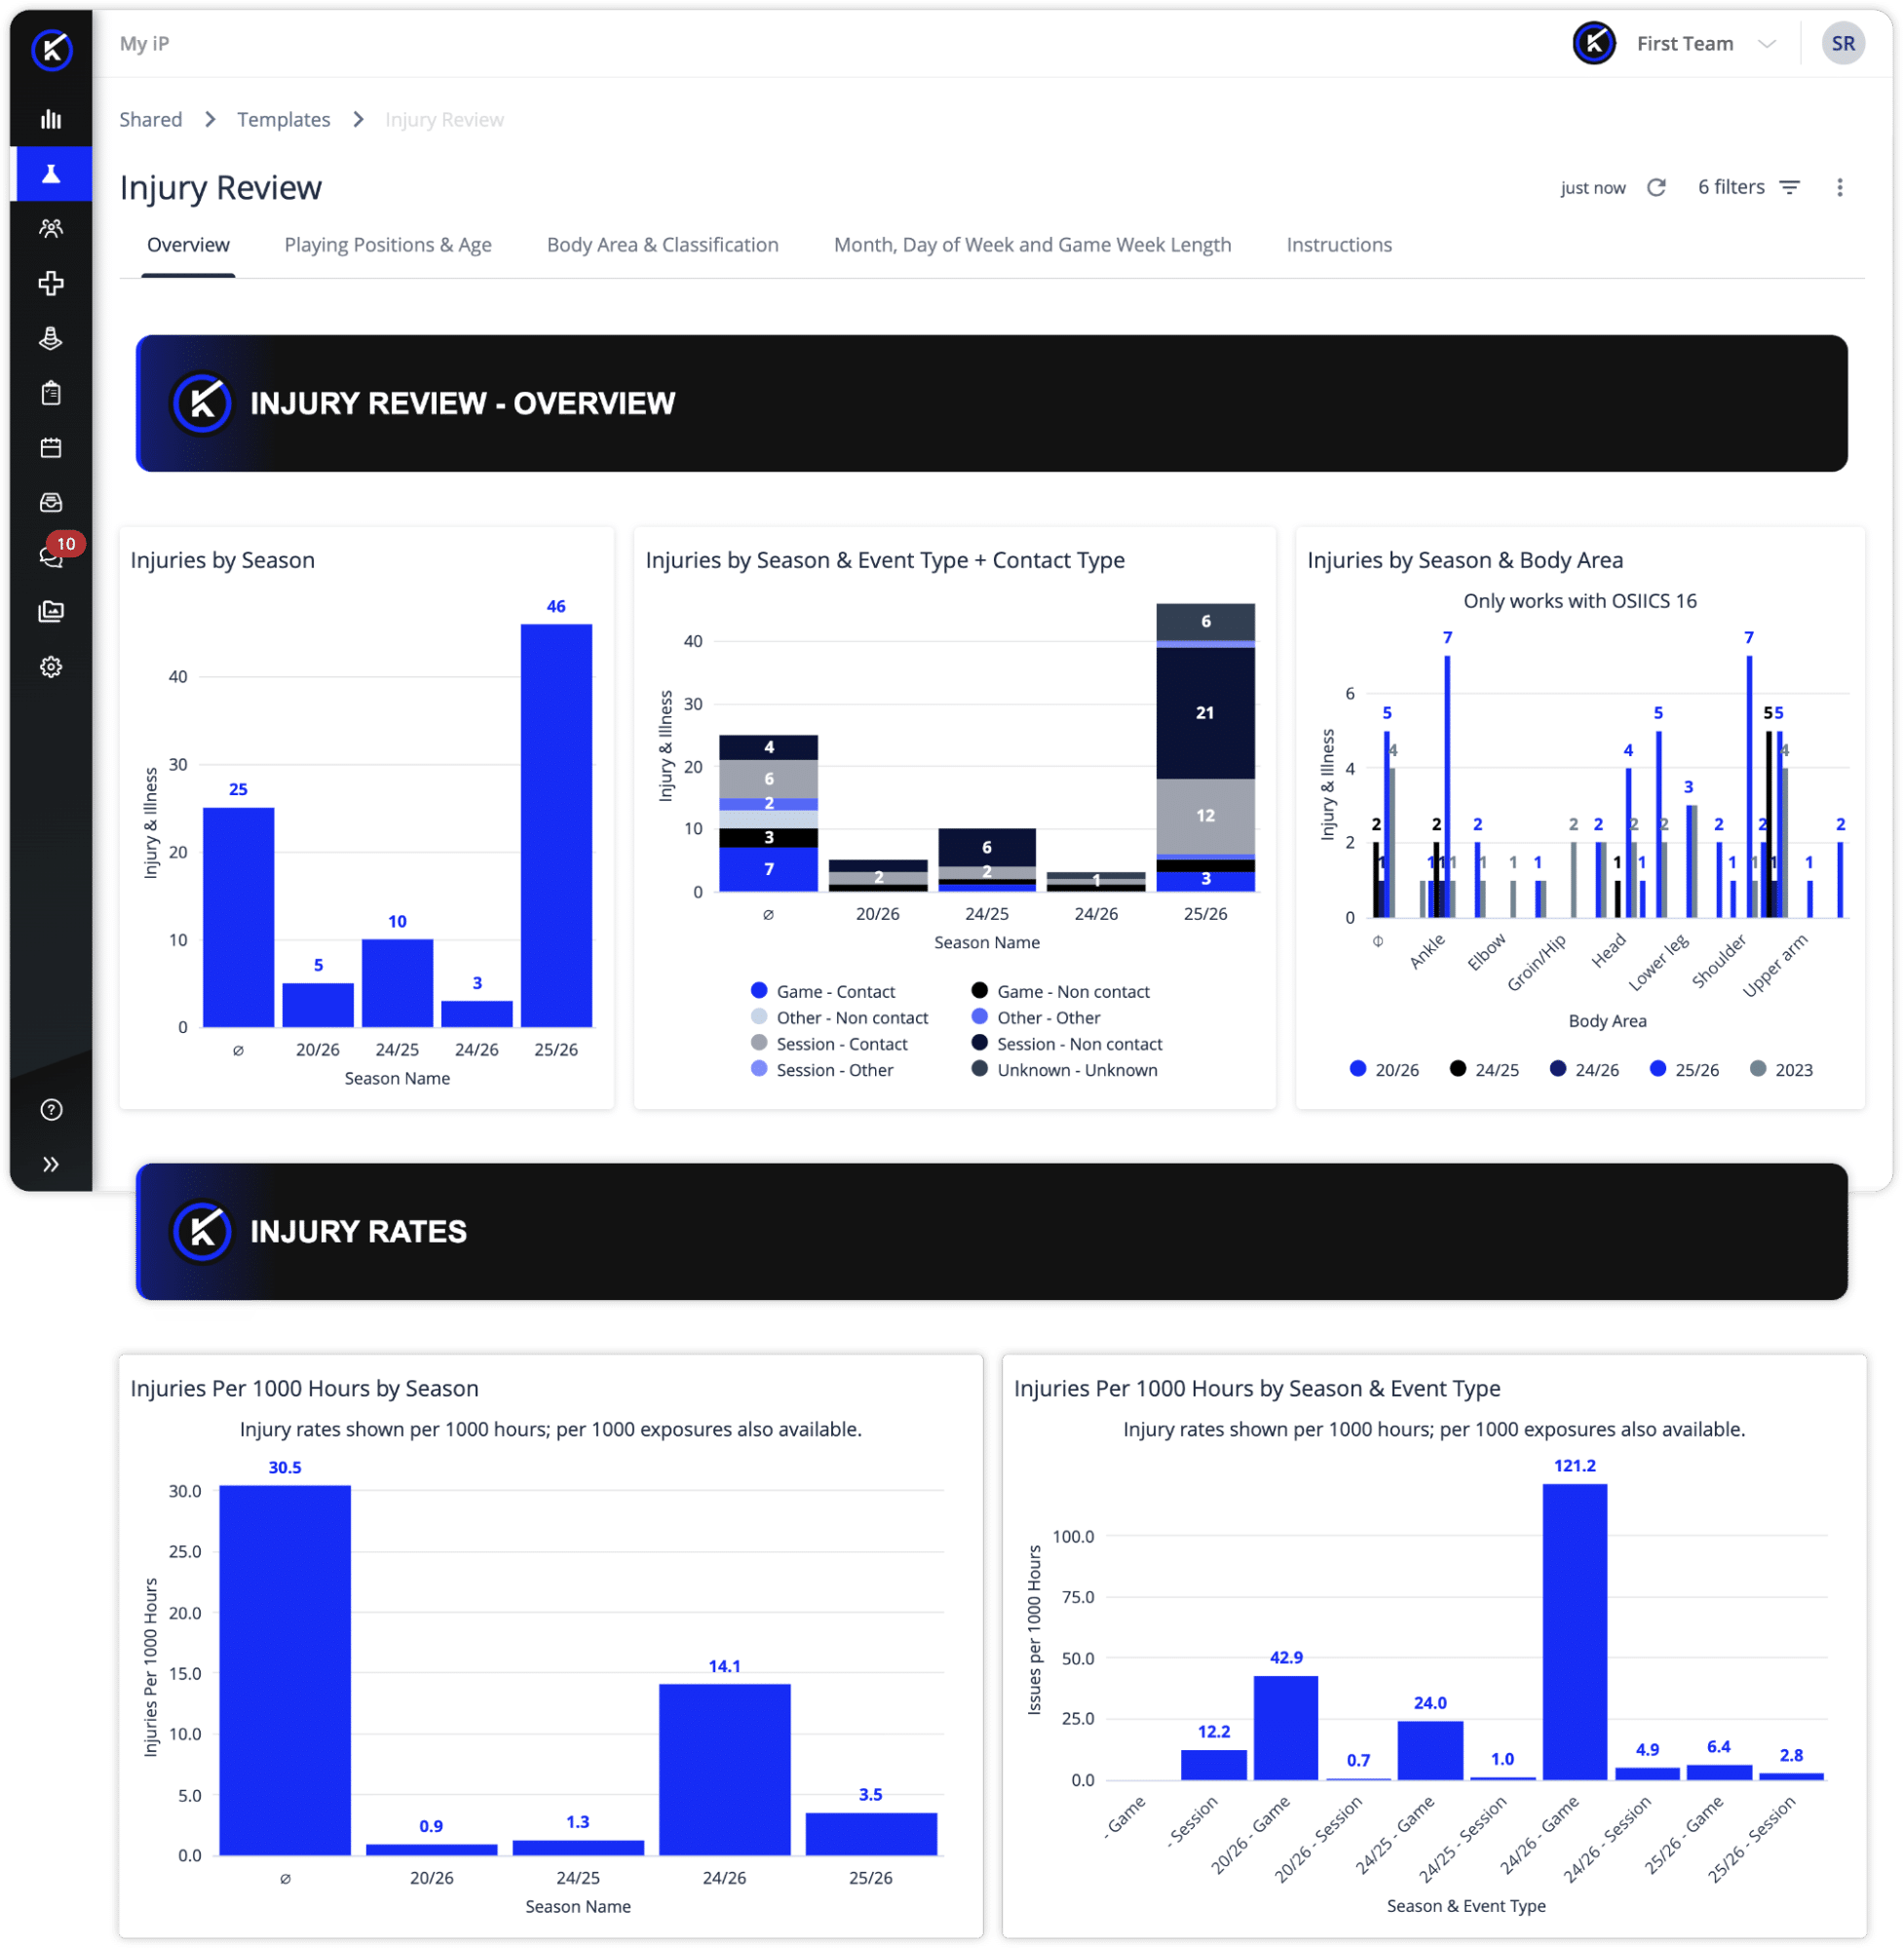
This makes it easier to move from high-level seasonal review into more detailed questions around position, age, body area, classification, timing, exposure type, and severity.
What the Injury Review Dashboard Helps You Understand
At its core, the dashboard helps medical teams answer a practical question:
What does the team’s injury profile look like, and where are the patterns that deserve closer review?
To support that, the dashboard organizes injury review into several connected areas of analysis, moving from a high-level overview of injury counts into deeper views of rates, burden, time-loss, position and age patterns, classification, body area, and timing.
INJURY OVERVIEW
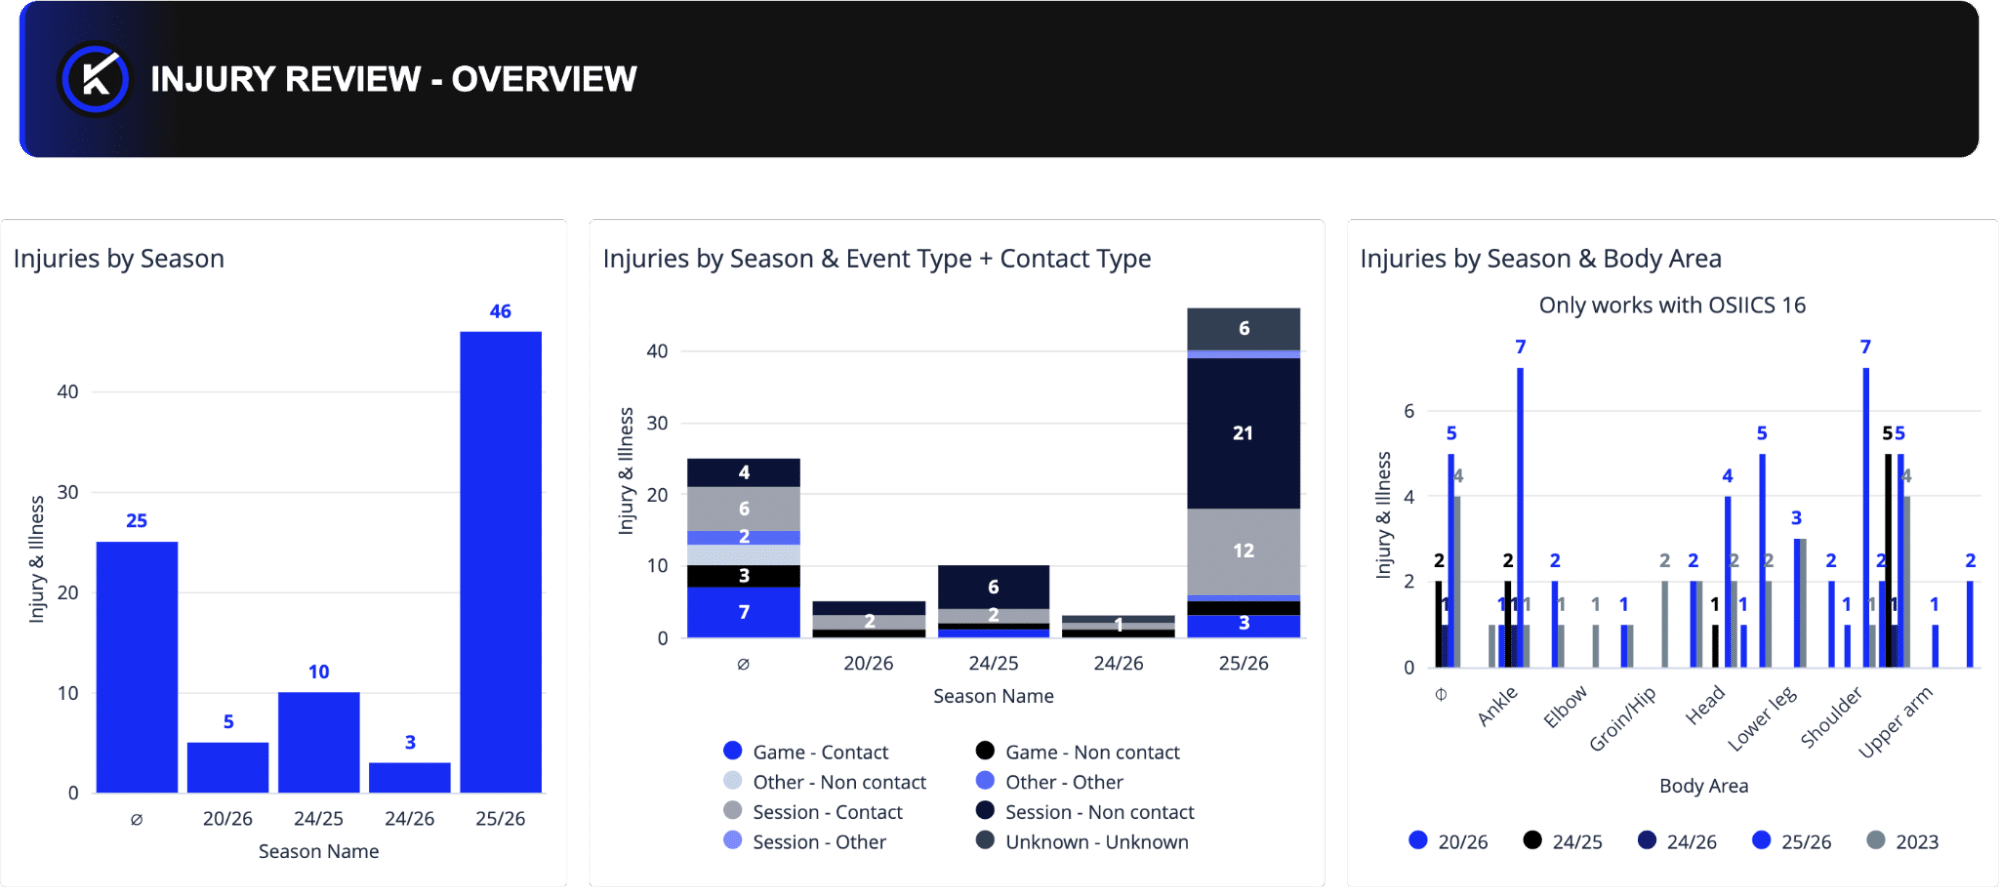
Start with a top-line view of injury counts across the seasons in scope, including how injuries are distributed by event type, contact type, and classification.
This gives medical leaders a clearer way to understand the overall injury picture before moving into more detailed analysis. From there, teams can begin to see whether the injury profile is changing year over year, where injuries are being sustained, and which categories may warrant closer review.
INJURY RATES
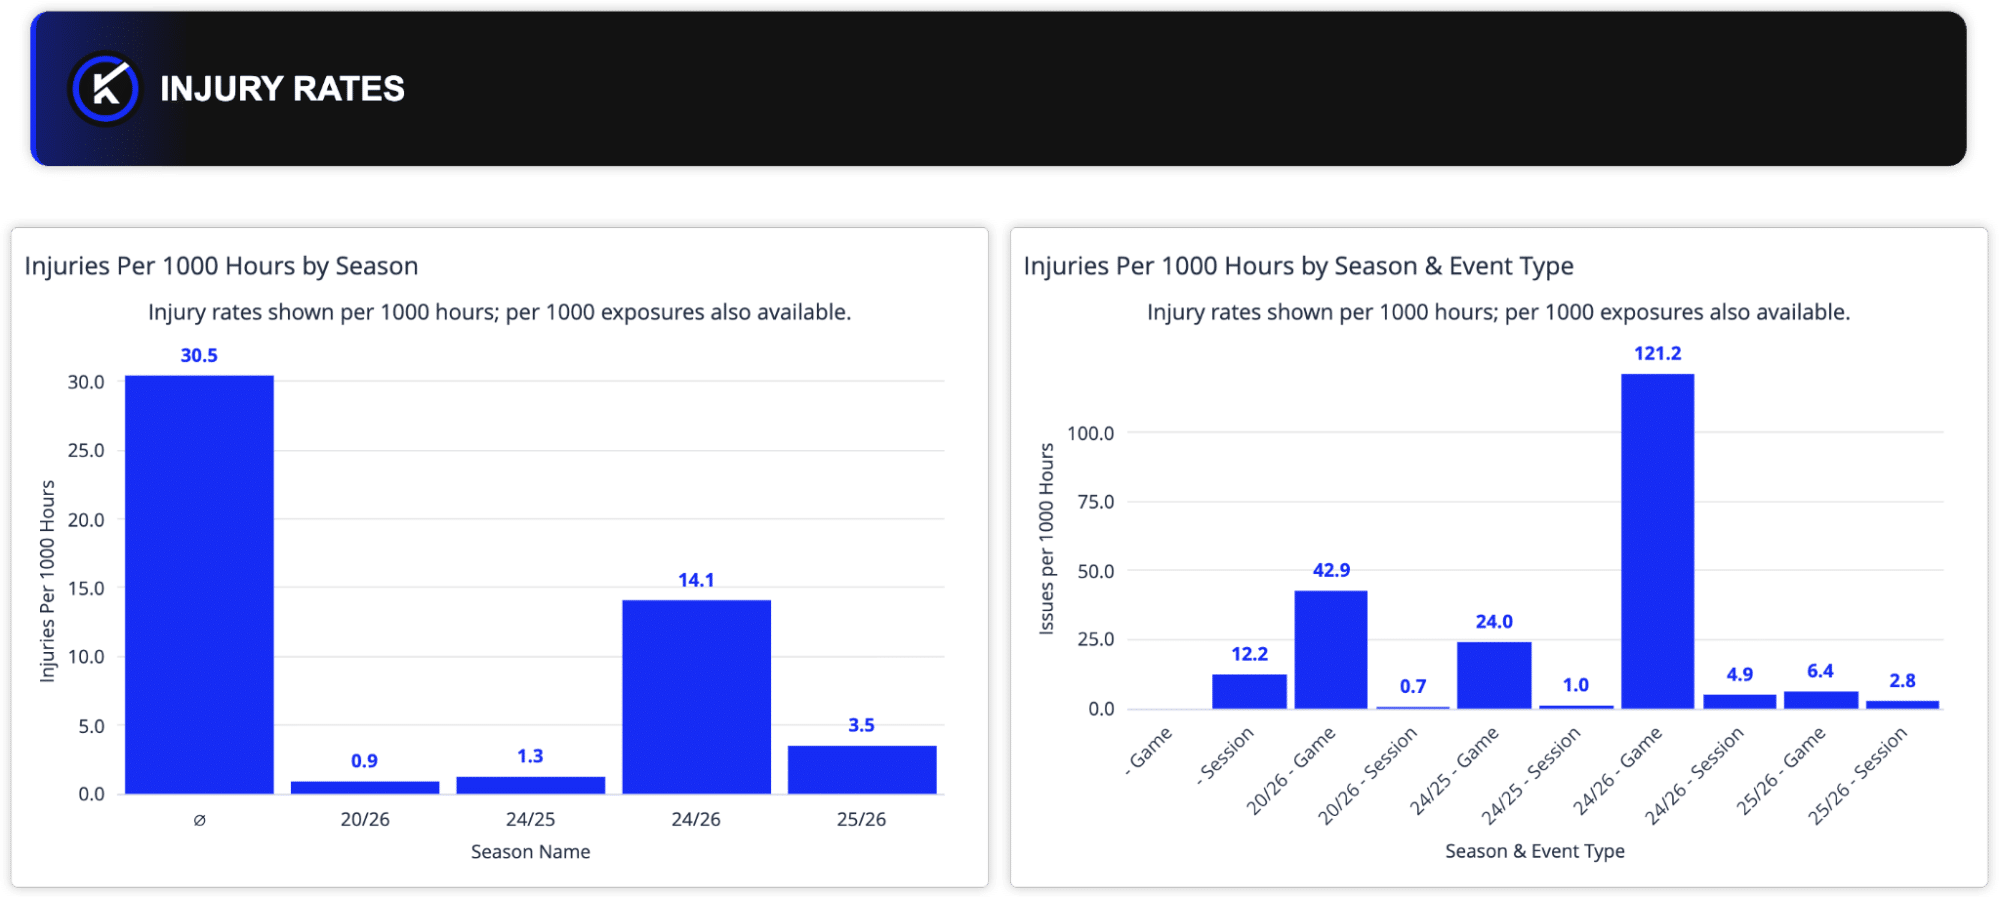
Raw injury counts only tell part of the story.
Exposure-adjusted rates help teams compare injuries more meaningfully across seasons, competition types, event types, positions, and subgroups. By reviewing injuries per 1,000 hours alongside raw counts, staff can better understand whether changes reflect a difference in injury rate or simply a difference in exposure.
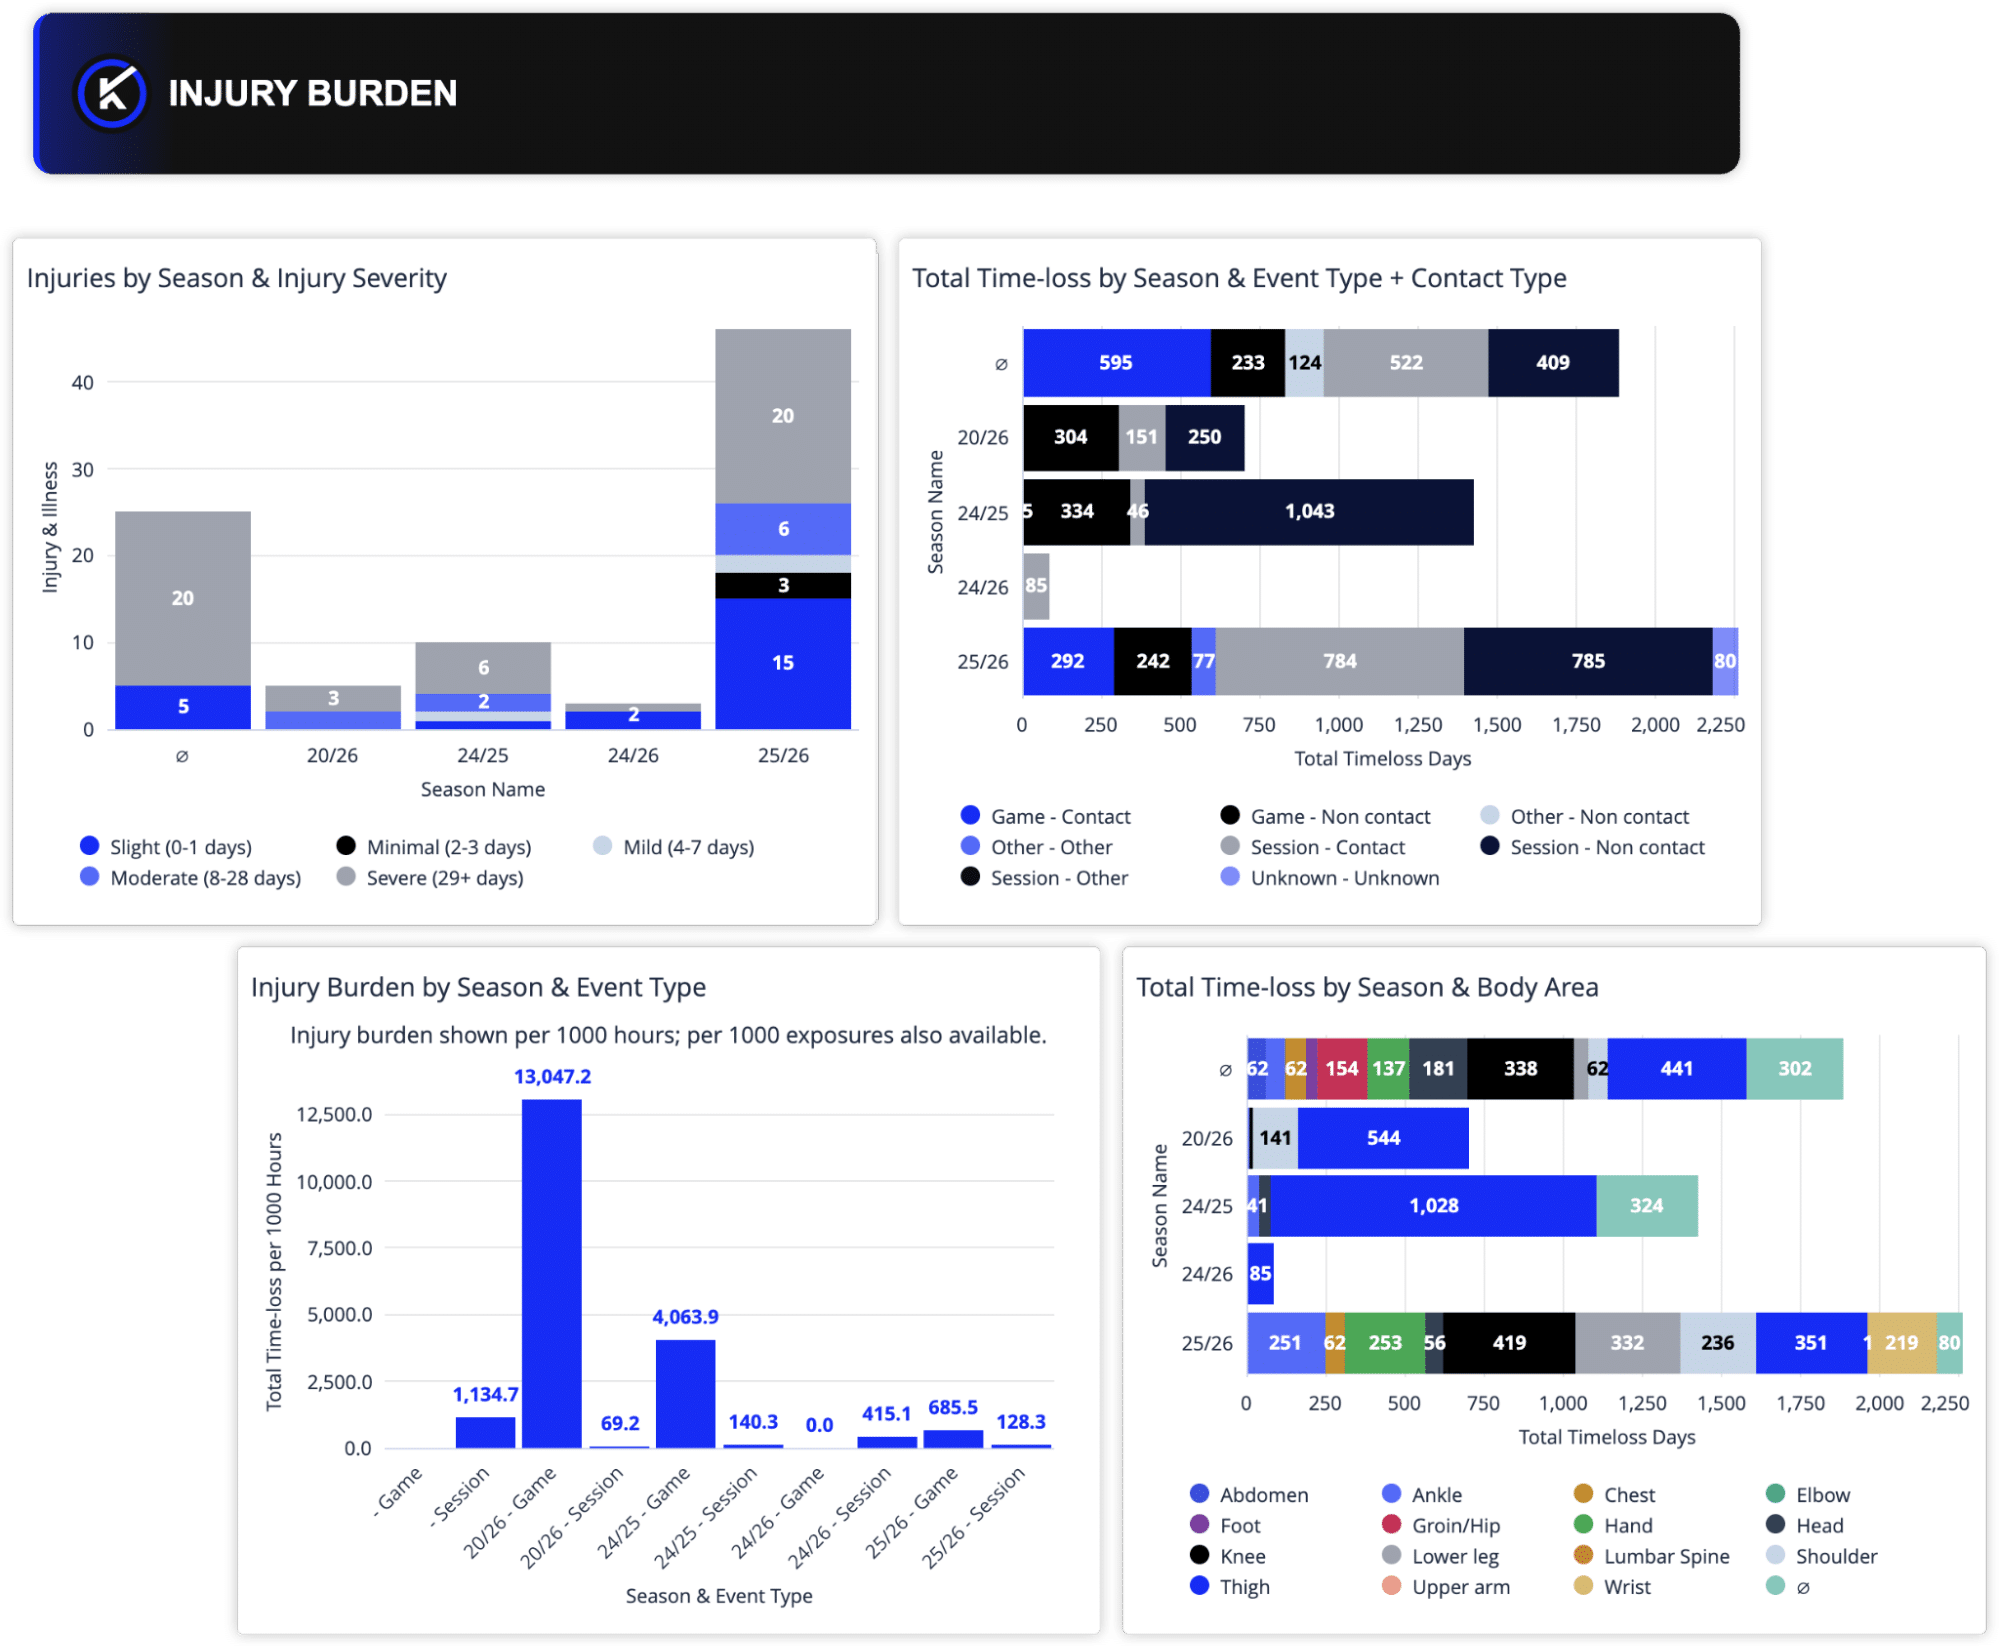
INJURY BURDEN AND TIME-LOSS
Some injuries occur often. Others create the greatest disruption.
By reviewing injury burden and total time-loss, medical teams can avoid confusing frequency with impact. This gives staff a clearer way to understand which injury types, mechanisms, or event settings are contributing most to lost availability.
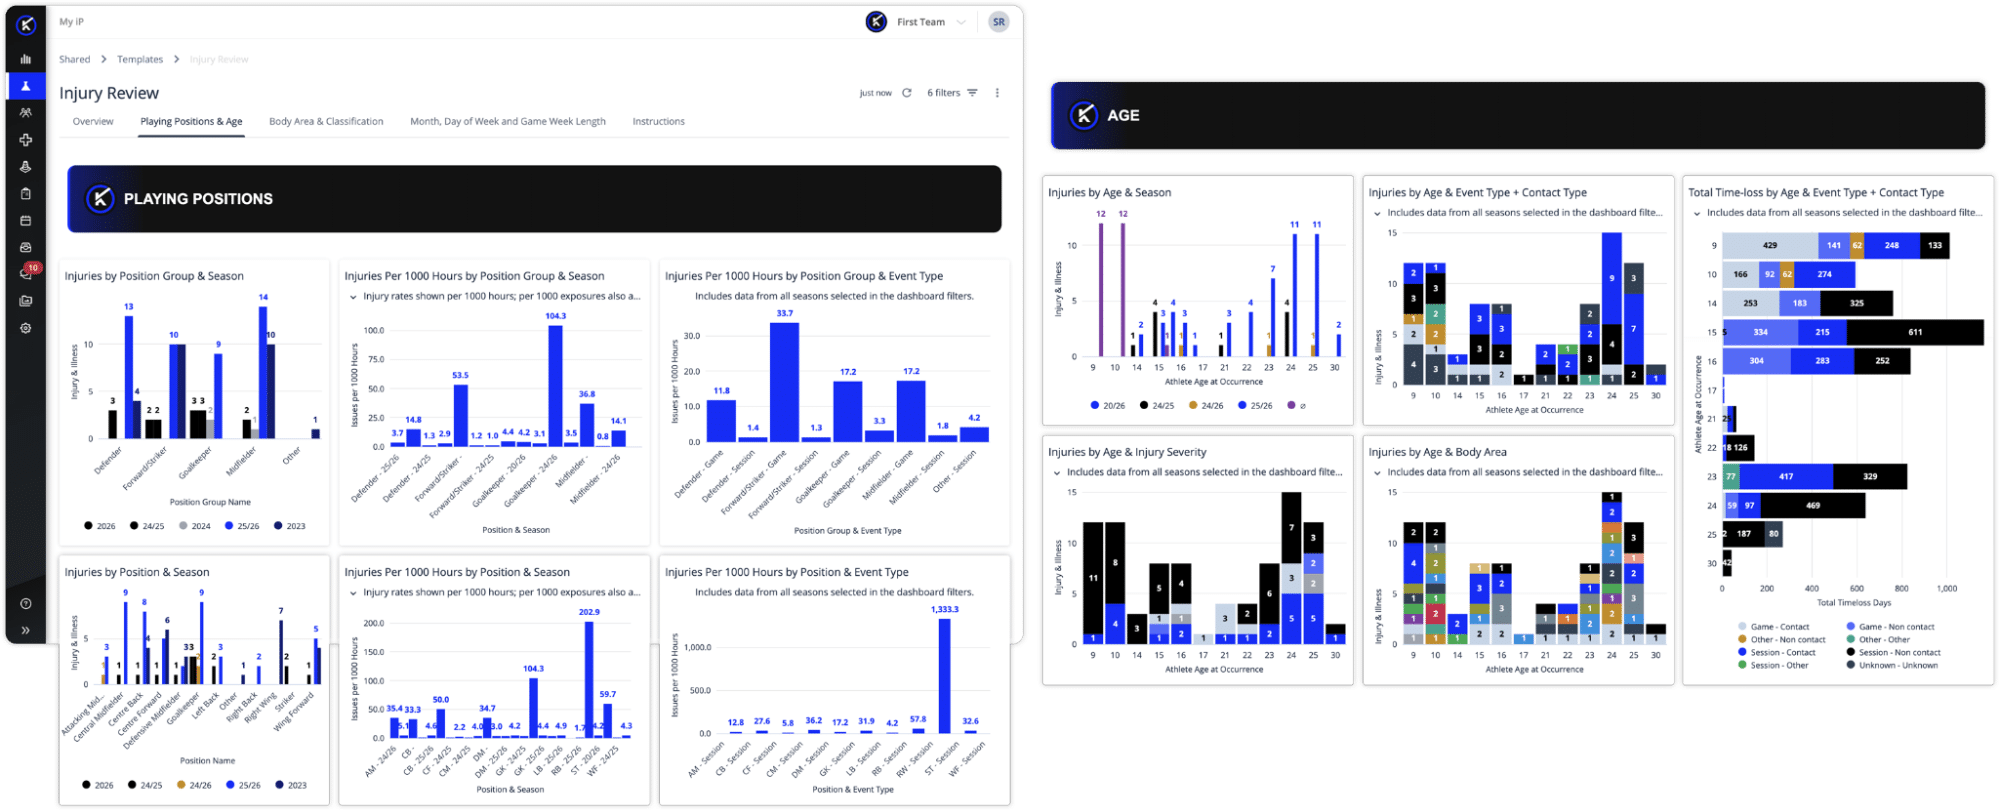
POSITION AND AGE PATTERNS
Injury profiles can vary across position groups, individual roles, and age.
Reviewing injury count, rate, and burden by position and age helps staff identify whether certain subgroups are experiencing different patterns. That can support more targeted conversations around prevention planning, training exposure, rehab strategy, and athlete support.
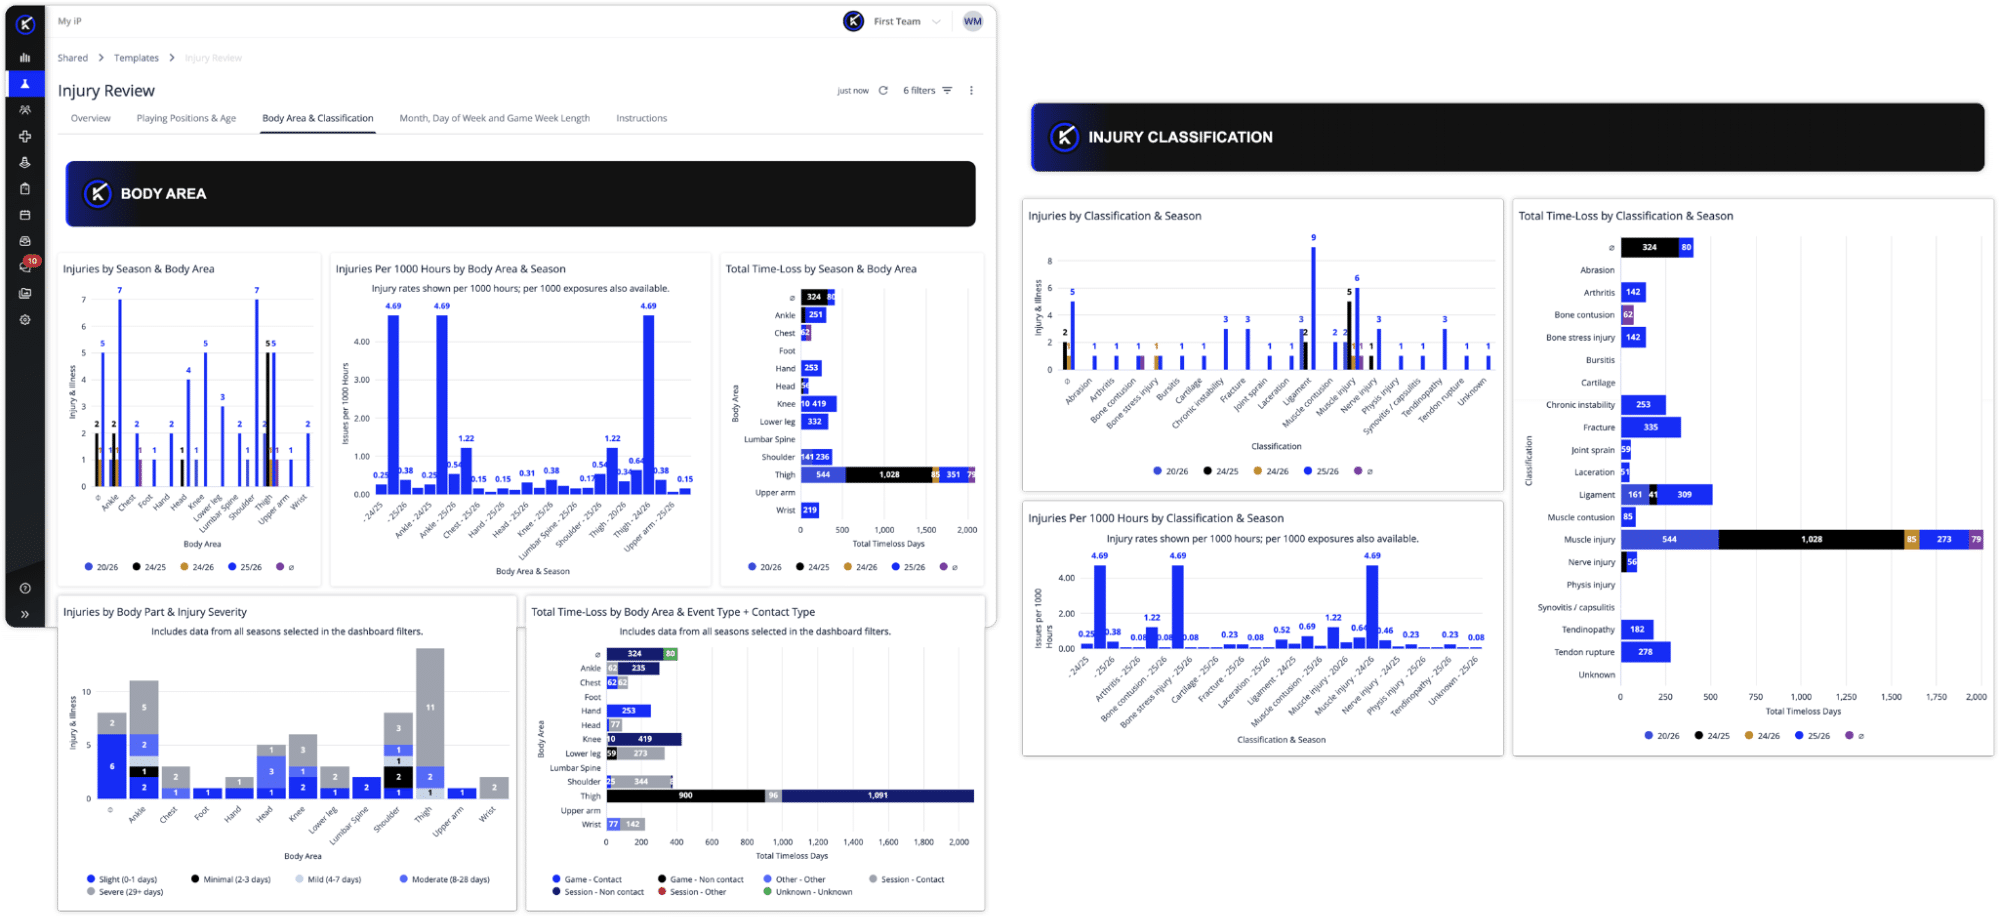
CLASSIFICATION AND BODY AREA
Understanding what types of injuries are occurring, and where they are occurring, is essential to meaningful injury review.
Classification and body area views help teams explore recurrent injury types, anatomical clusters, severity patterns, and time-loss impact that may deserve clinical or performance attention.
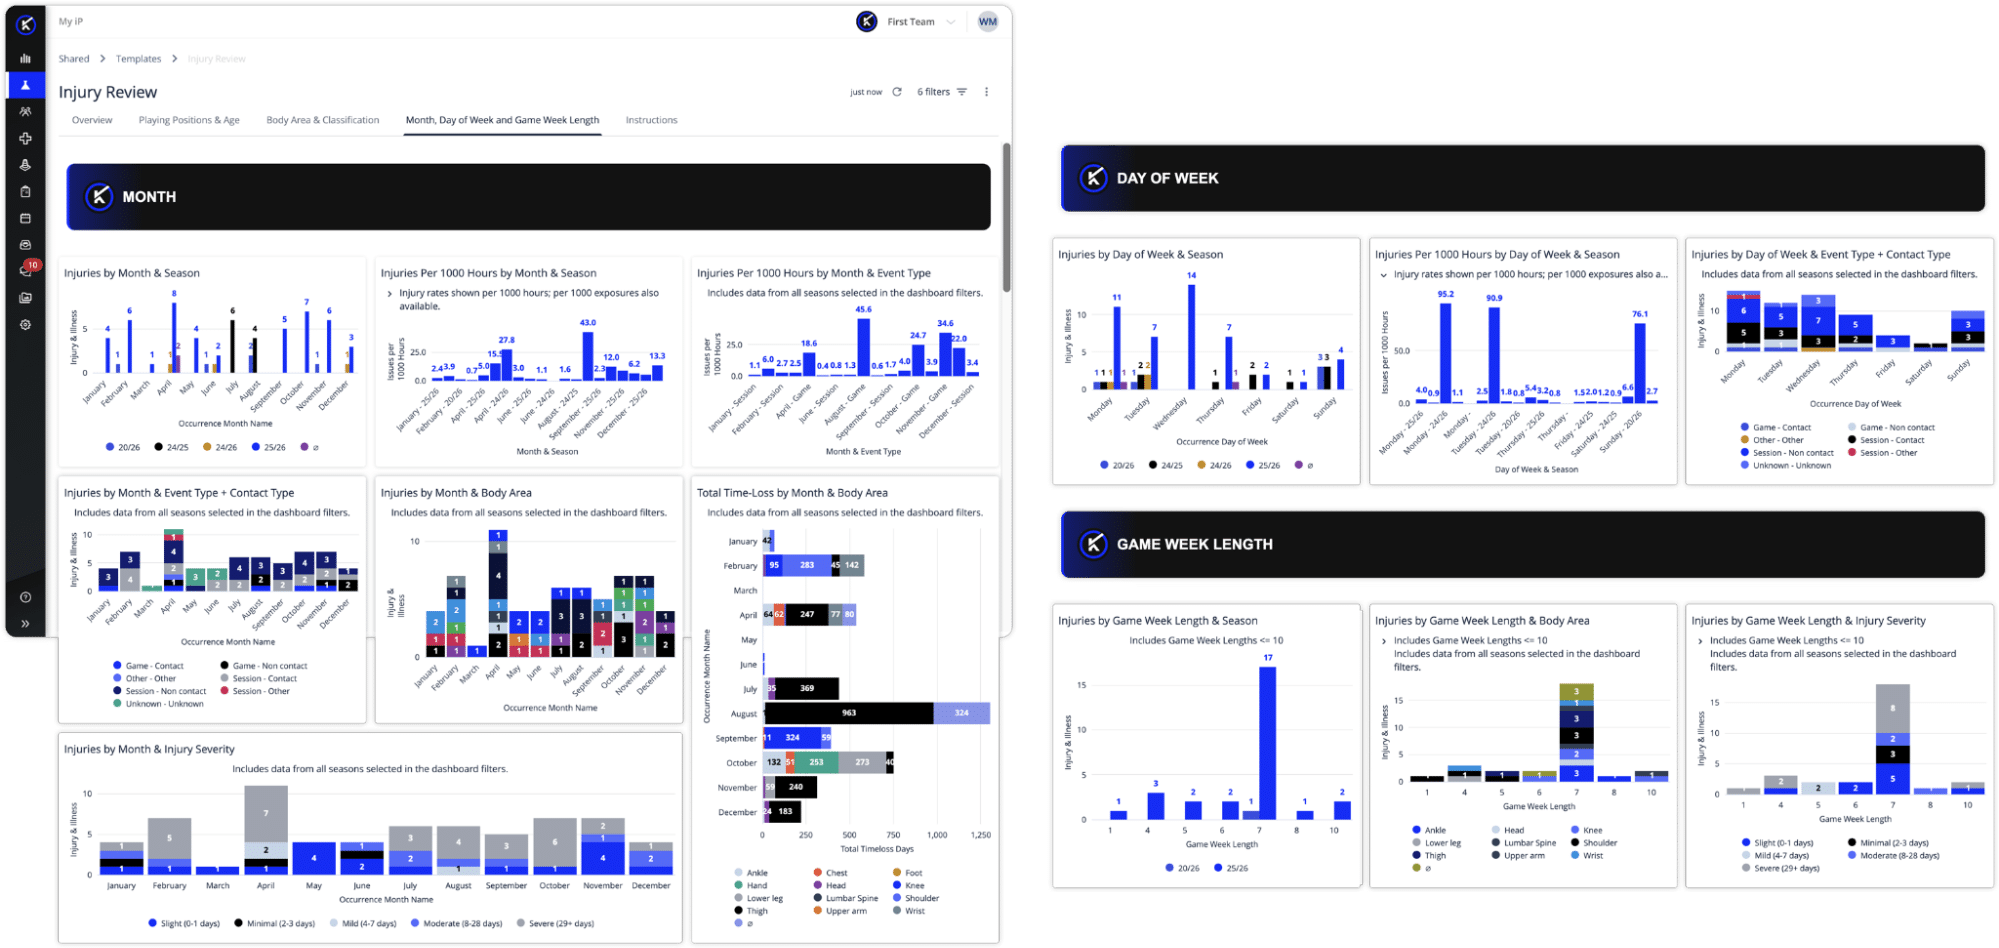
TIMING AND COMPETITION CADENCE
Injuries do not happen in isolation from the calendar.
By reviewing patterns across month, day of week, and shorter turnaround periods, teams can explore whether timing, competition cadence, or congested periods may be associated with elevated injury count, rate, burden, or severity.
What This Looks Like in Practice
The Injury Review Dashboard supports a natural progression from high-level seasonal review to more detailed investigation. Because the template can be adapted, teams can keep that review structure consistent while tailoring the dashboard to the injury categories, reporting needs, and planning questions most relevant to their organization.
- A Head of Medical can review the team’s overall injury profile, understand how incidence and burden are shifting across seasons, and prepare for medical board reviews, governing body reporting, or season debriefs.
- Physios and Athletic Trainers can explore patterns by body area, classification, time-loss, and severity to understand whether current cases fit a wider team pattern or appear more isolated.
- Performance staff can review exposure-adjusted rates by position, age, and event type to better understand how training and competition exposure may relate to injury outcomes.
These are common examples of how teams can apply the dashboard in practice.
Supporting Injury Review Without Replacing Practitioner Judgment
The dashboard is designed to support decision-making, not automate it.
Its purpose is not to tell medical teams what action to take. It is to make injury information easier to see, compare, interpret, and discuss. By bringing incidence, burden, time-loss, rates, and patterns into one place, the dashboard gives staff a stronger starting point for conversations about injury surveillance, prevention planning, rehab strategy, and reporting.
Used alongside data health checks in My iP for athlete, injury, and game records, it gives staff a more consistent foundation for the conversations that follow.