The FIFA World Cup has always been difficult to predict. One moment changes everything: a saved penalty, a late goal, a red card, a player carrying an injury deeper than expected. That uncertainty is part of what makes it compelling.
In 2026, it gets bigger. For the first time the tournament expands to 48 teams, in 12 groups of four, with a new Round of 32 that means the champions must win five knockout matches, not four. More teams, more matches, more pathways, more ways for the expected story to change.
So we ran it. At Kitman Labs we simulated the full tournament 100,000 times under the official 2026 structure. Match probabilities are modelled with an Elo rating system, the framework first built for chess and now widely used to predict football results, applied across every fixture from the group stage through the final.
No model can predict the moments that decide a World Cup. But it can reveal something useful before they happen: which teams hold the strongest path, which contenders face a harder route, and where the margins between favorite and challenger begin to narrow.
The 48-Team Era Changes the Path to the Trophy
The expanded format makes 2026 a different kind of test. In previous editions, contenders survived three group matches and four knockout rounds. Now the route is longer, and the new Round of 32 adds another elimination match, raising the value of squad depth, tactical adaptability, and consistency across a longer tournament.
It also changes how probability behaves. A team can be heavily favored to escape its group without that translating into a strong chance of winning the tournament, because each extra knockout match adds another opportunity for variance. The best teams still hold the best odds, but the gap between reaching the later stages and actually lifting the trophy can be wide.
That distinction matters. The model does not ask “who is the best team?” It asks “how often does this team survive this exact structure?” In 2026, structure matters more than ever.
What the Model Reveals at the Top
Across 100,000 simulations, Spain emerged with the highest title probability at 18%. That does not mean Spain is expected to win. It means that, given the model inputs and the projected knockout path, Spain held the strongest combination of team strength and route.
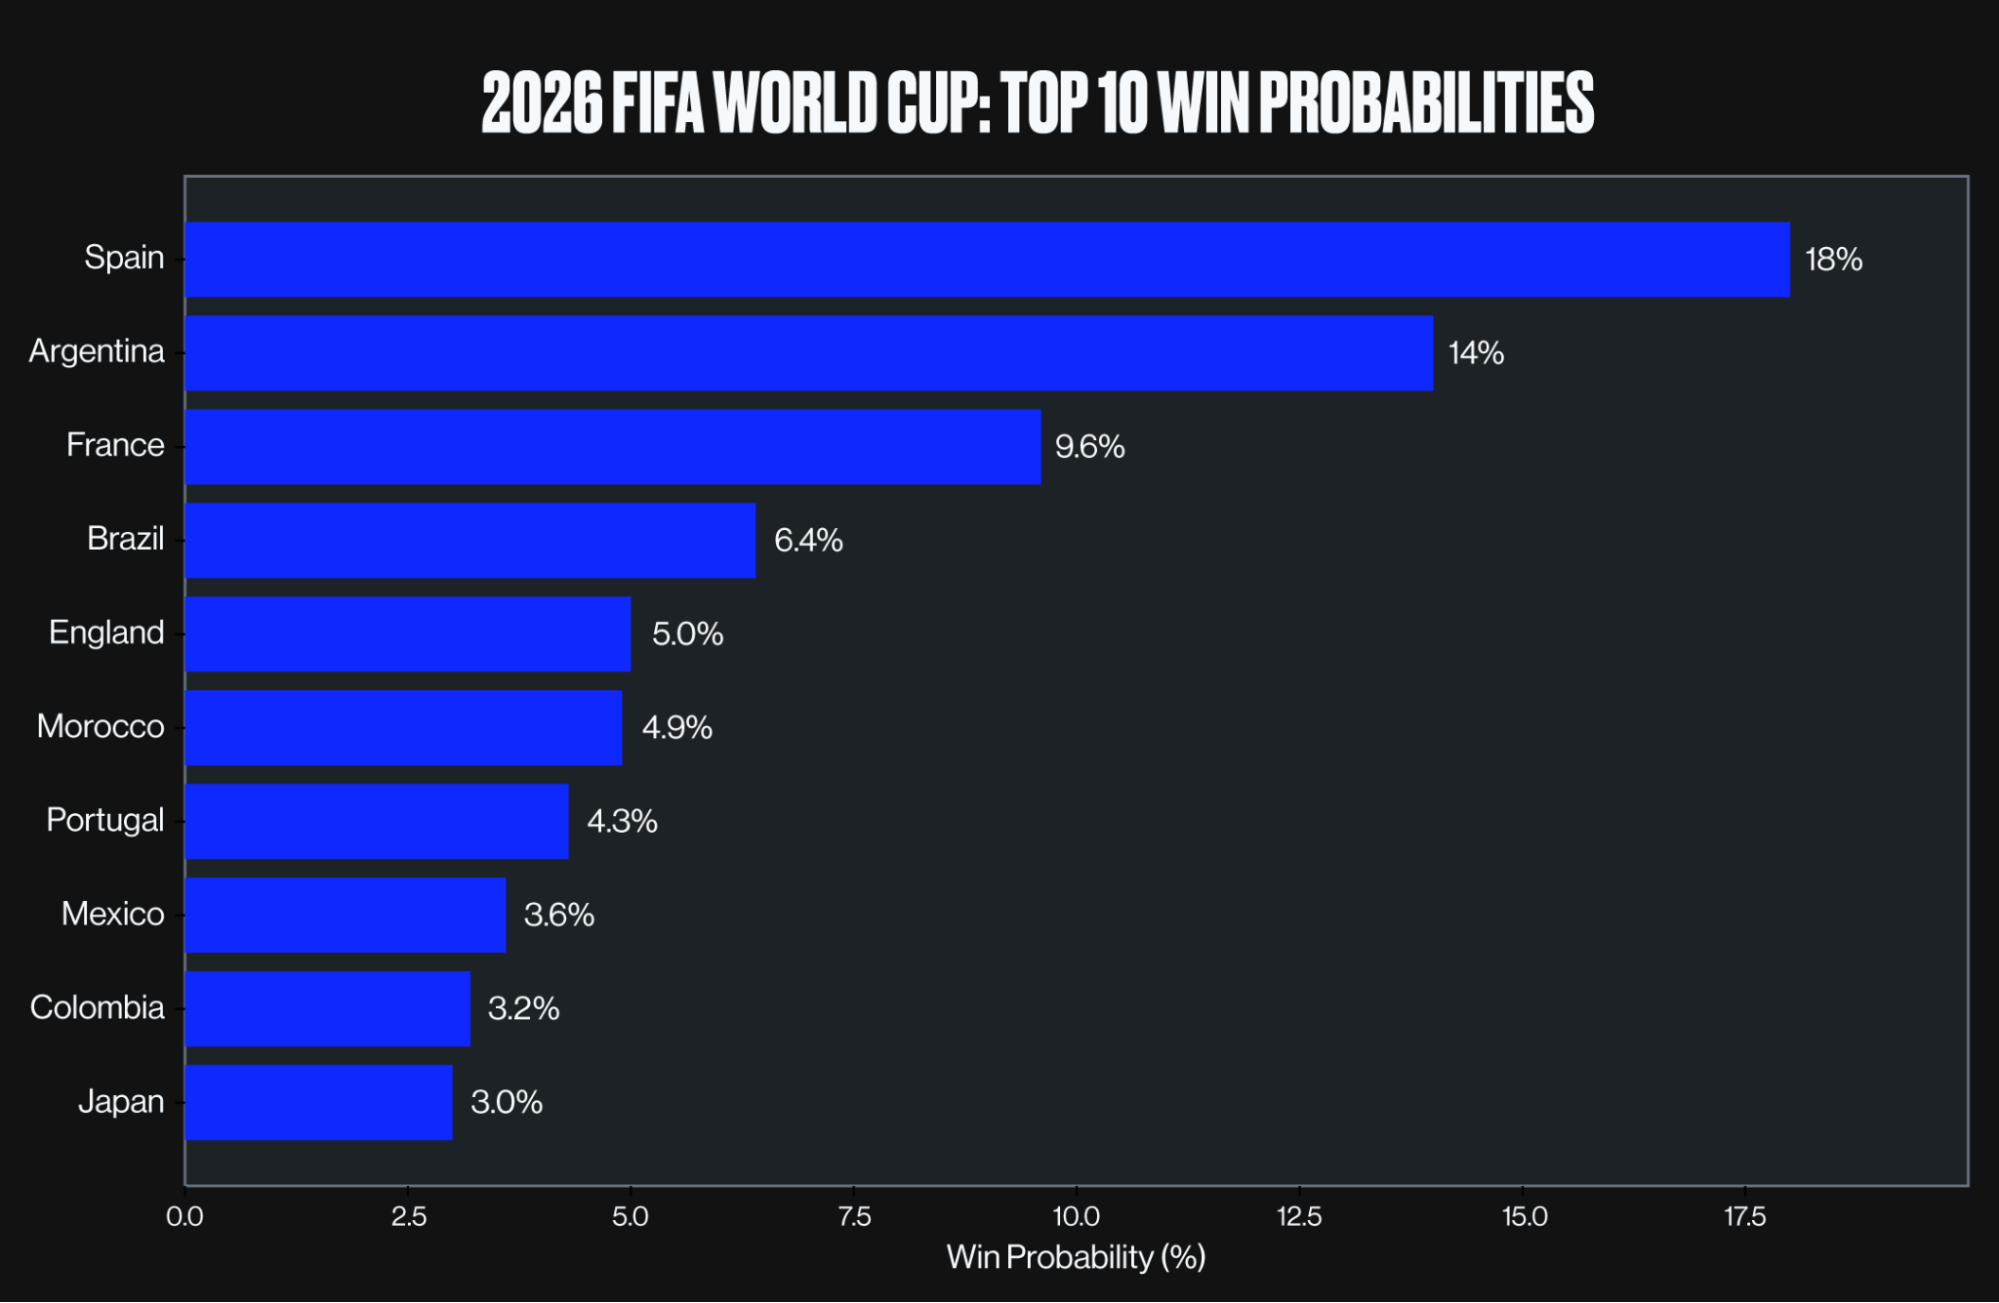
Spain leads the field, but the title race stays open: even the strongest favorite wins fewer than one in five simulated tournaments.
Spain – 18% Spain’s numbers show the shape of a true favorite: a Round of 32 in 99% of simulations, the quarterfinals in 52%, the semifinals in 40%, and the final in 27%. Euro 2024 winners and unbeaten in 31 competitive matches in regulation, Luis de la Fuente’s side pairs the midfield control of Rodri and Pedri with the pace of Lamine Yamal, whose late-season fitness is the one open question. The path is not risk-free, but no team carries a cleaner statistical profile.
Argentina – 14% The defending champions’ case rests less on raw quality than on tournament experience and game management, the proven ability to handle high-pressure knockout football with a largely intact Qatar core led by Lionel Messi. They reached the final in 23% of simulations and won it in 14%, placing them firmly in the top tier.
France – 9.6% The squad may be the deepest in the tournament, with Kylian Mbappé leading an attack stocked several names deep, but the model reflects the difficulty of the route as much as the talent. France reached the semifinals in 29% of simulations and the final in 17%, with the title probability held down by a likely knockout path that often runs through Spain.
Together, Spain, Argentina, and France form the clearest top group. Each has the quality to win and progresses deep at a high rate. Even so, the model separates them: Spain’s path looks slightly more favorable, Argentina’s pedigree keeps them close, and France’s route creates more friction despite the talent.
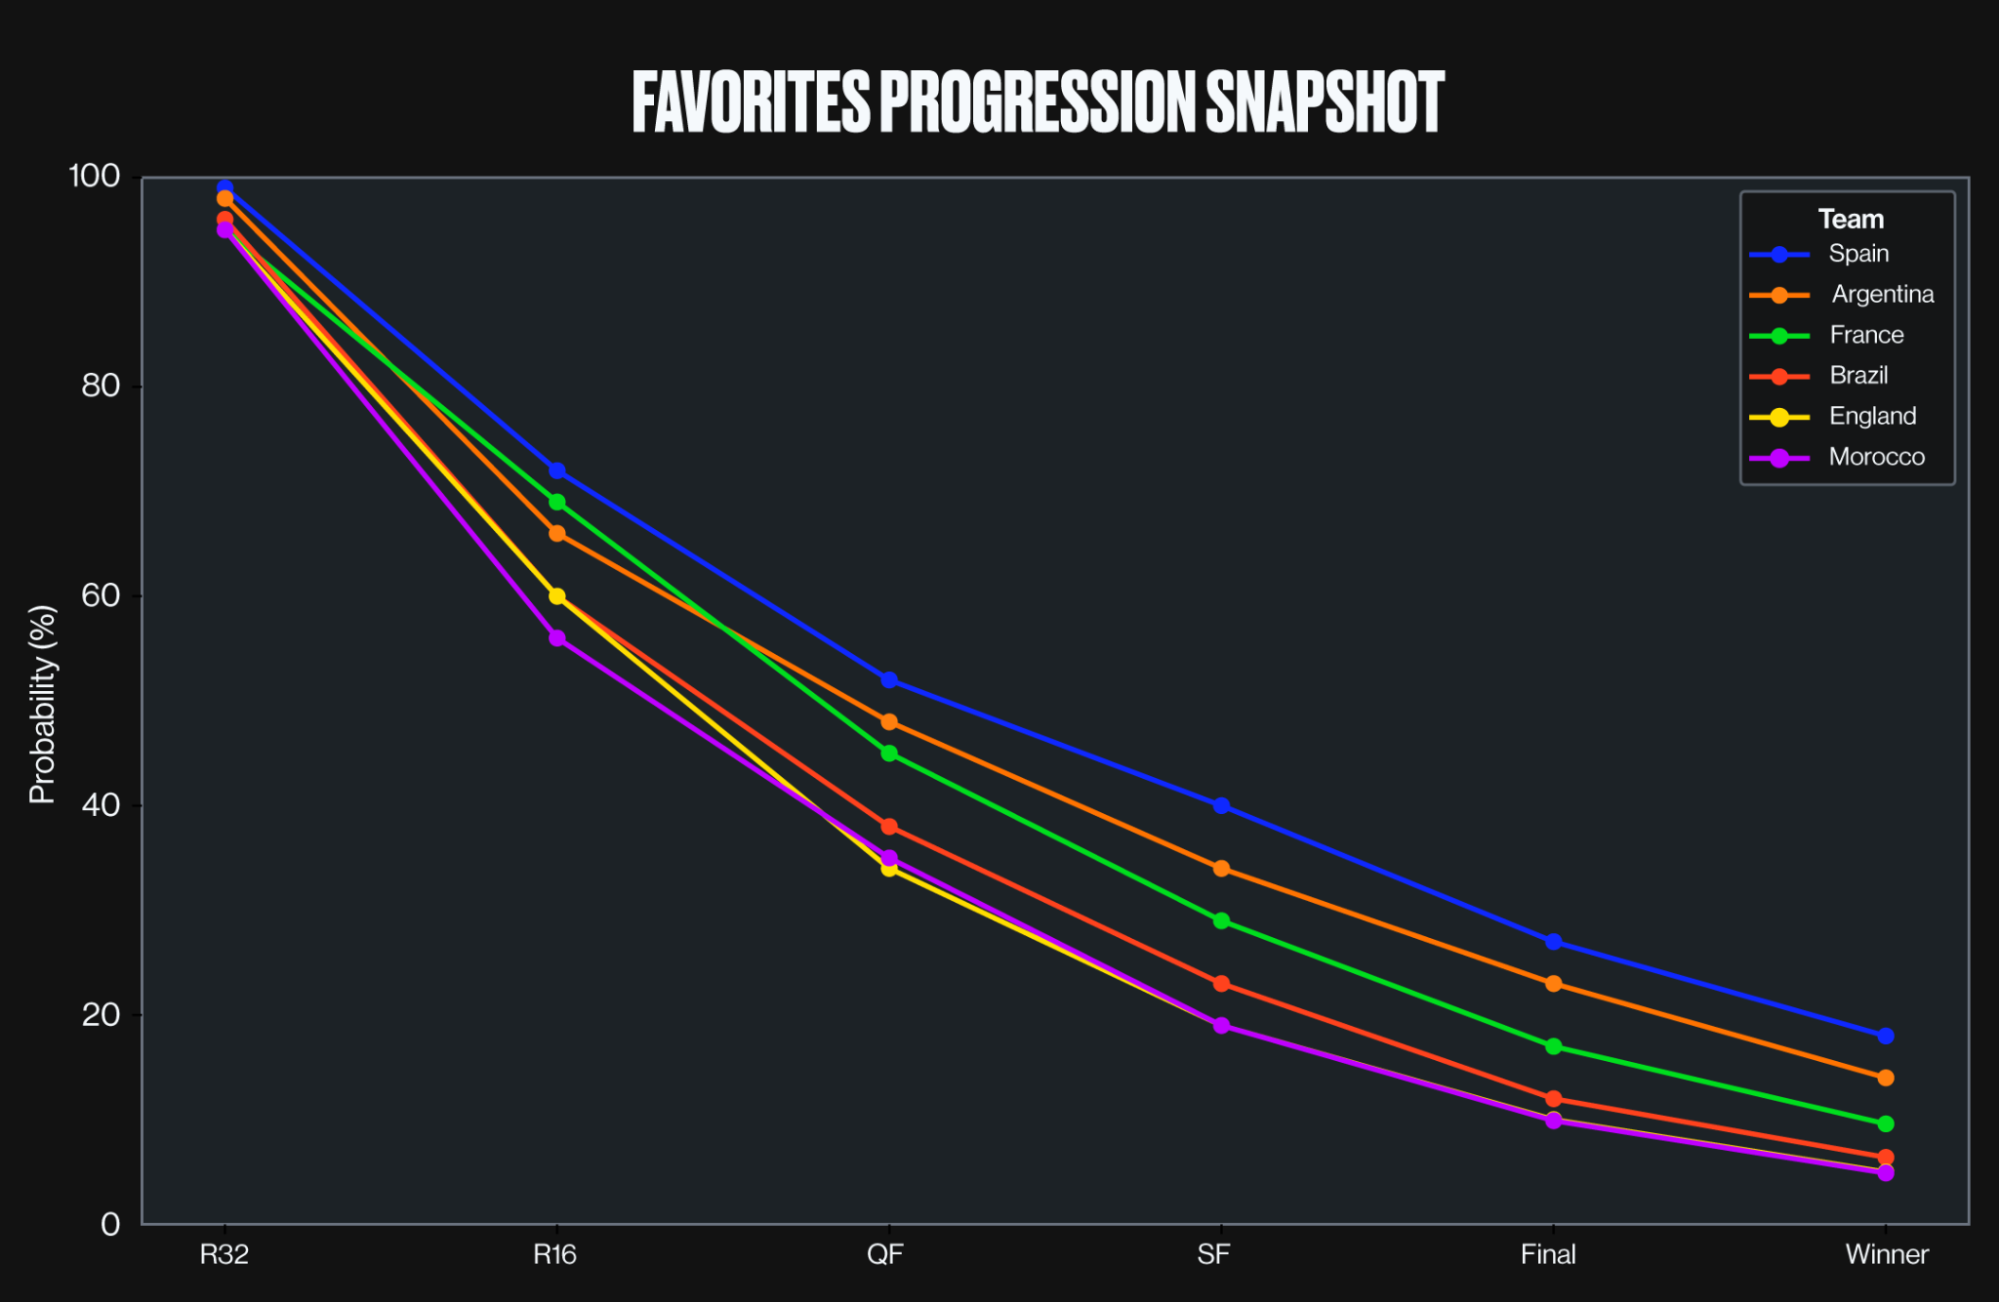
The favorites separate early, but the gap widens deeper into the knockout rounds, where each additional match sharply reduces title probability.
The Contenders With More Complicated Paths
Behind the top three, the picture opens up.
Brazil – 6.4% On talent, Brazil is always part of the conversation, but the model points to a more complicated path: the quarterfinals in 38% of simulations and the semifinals in 23%, with the probability falling away in the final stages. Carlo Ancelotti’s rebuild, with Vinícius Júnior as the focal point, is still settling, and the pattern is a familiar one: the quality to beat anyone, but the likely need to beat several elite teams in succession to win it all.
England – 5.0% England’s profile is the sharpest illustration of the model’s central lesson. England reached the Round of 32 in 95% of simulations and the semifinals in 19%, yet their title probability sits far lower. Reaching the later stages and converting them into a trophy are very different challenges, and under Thomas Tuchel the question is the long-standing one: delivering in the biggest games, not merely arriving at them.
Dark Horse: Morocco – 4.9% Morocco is one of the model’s most compelling teams, ahead of several traditional powers. That reinforces their standing as a credible dark horse rather than a long-shot story. Building on a 2022 semifinal run that reshaped expectations, their path is not easy, but the simulations show genuine tournament upside.
Portugal, Colombia, Germany, Japan, the Netherlands, Senegal, and Uruguay round out the broader contender tier. Each has a realistic route to the latter stages, but the curve is steep. Once the quarterfinals and semifinals arrive, the need to beat several high-quality opponents compresses the odds quickly.
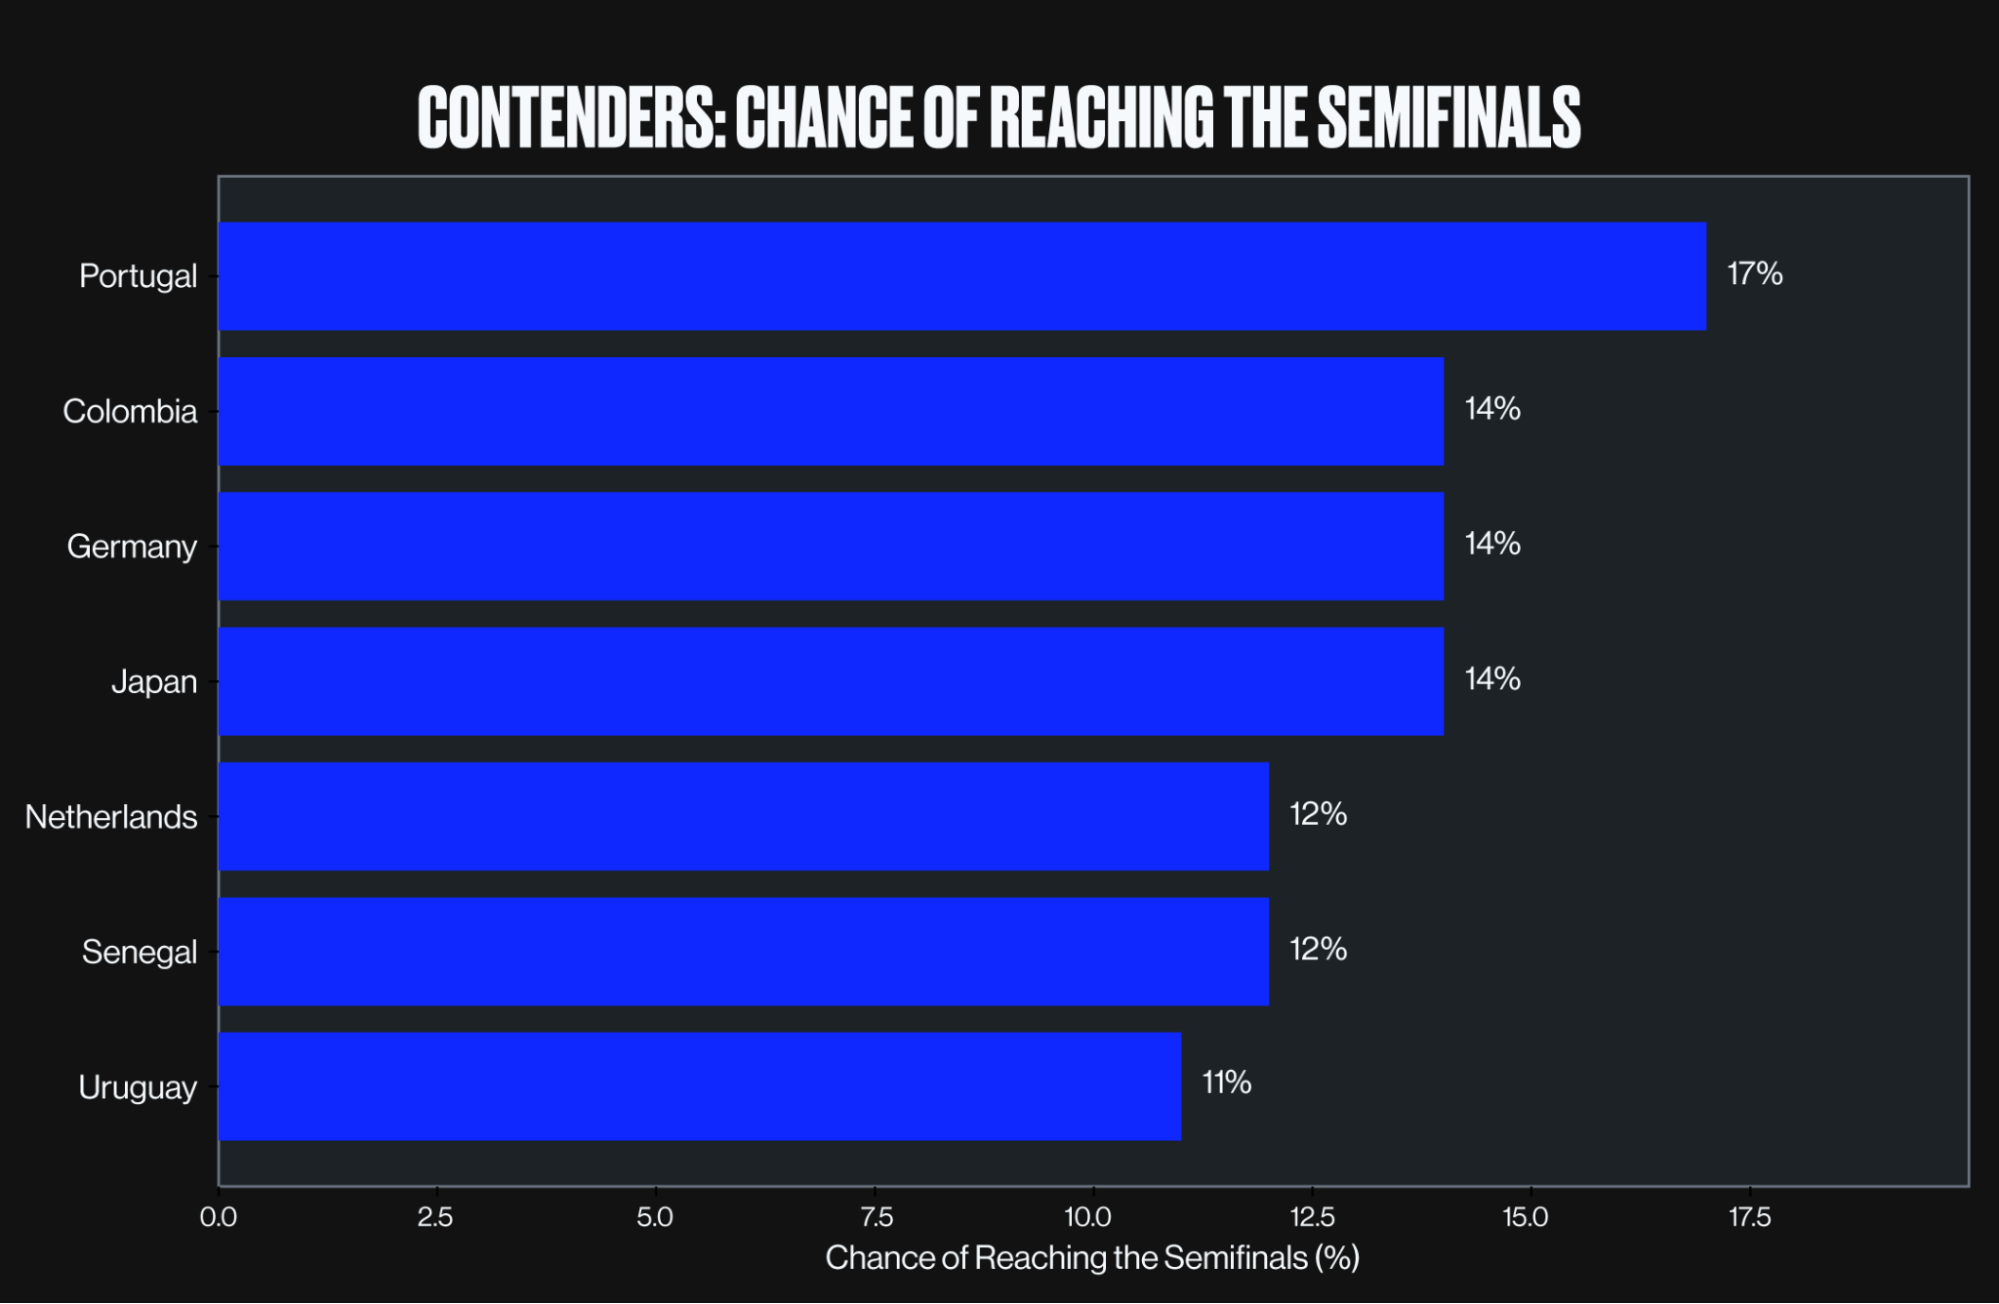
The chasing pack: each has a realistic route to the last four,
but the odds compress quickly once there.
That is where simulation helps: separating teams that can make a run from teams more likely to finish one.
⇨ Want the full stage-by-stage view? Download the complete simulation table to see how the top 20 teams progress through every round.
The Host Nation Effect
The 2026 World Cup adds another variable: three host nations. The United States, Canada, and Mexico each play their group matches at home. But the model shows home advantage alone does not create equal opportunity, because the draw, the path, and underlying team strength still shape the odds of a deep run.
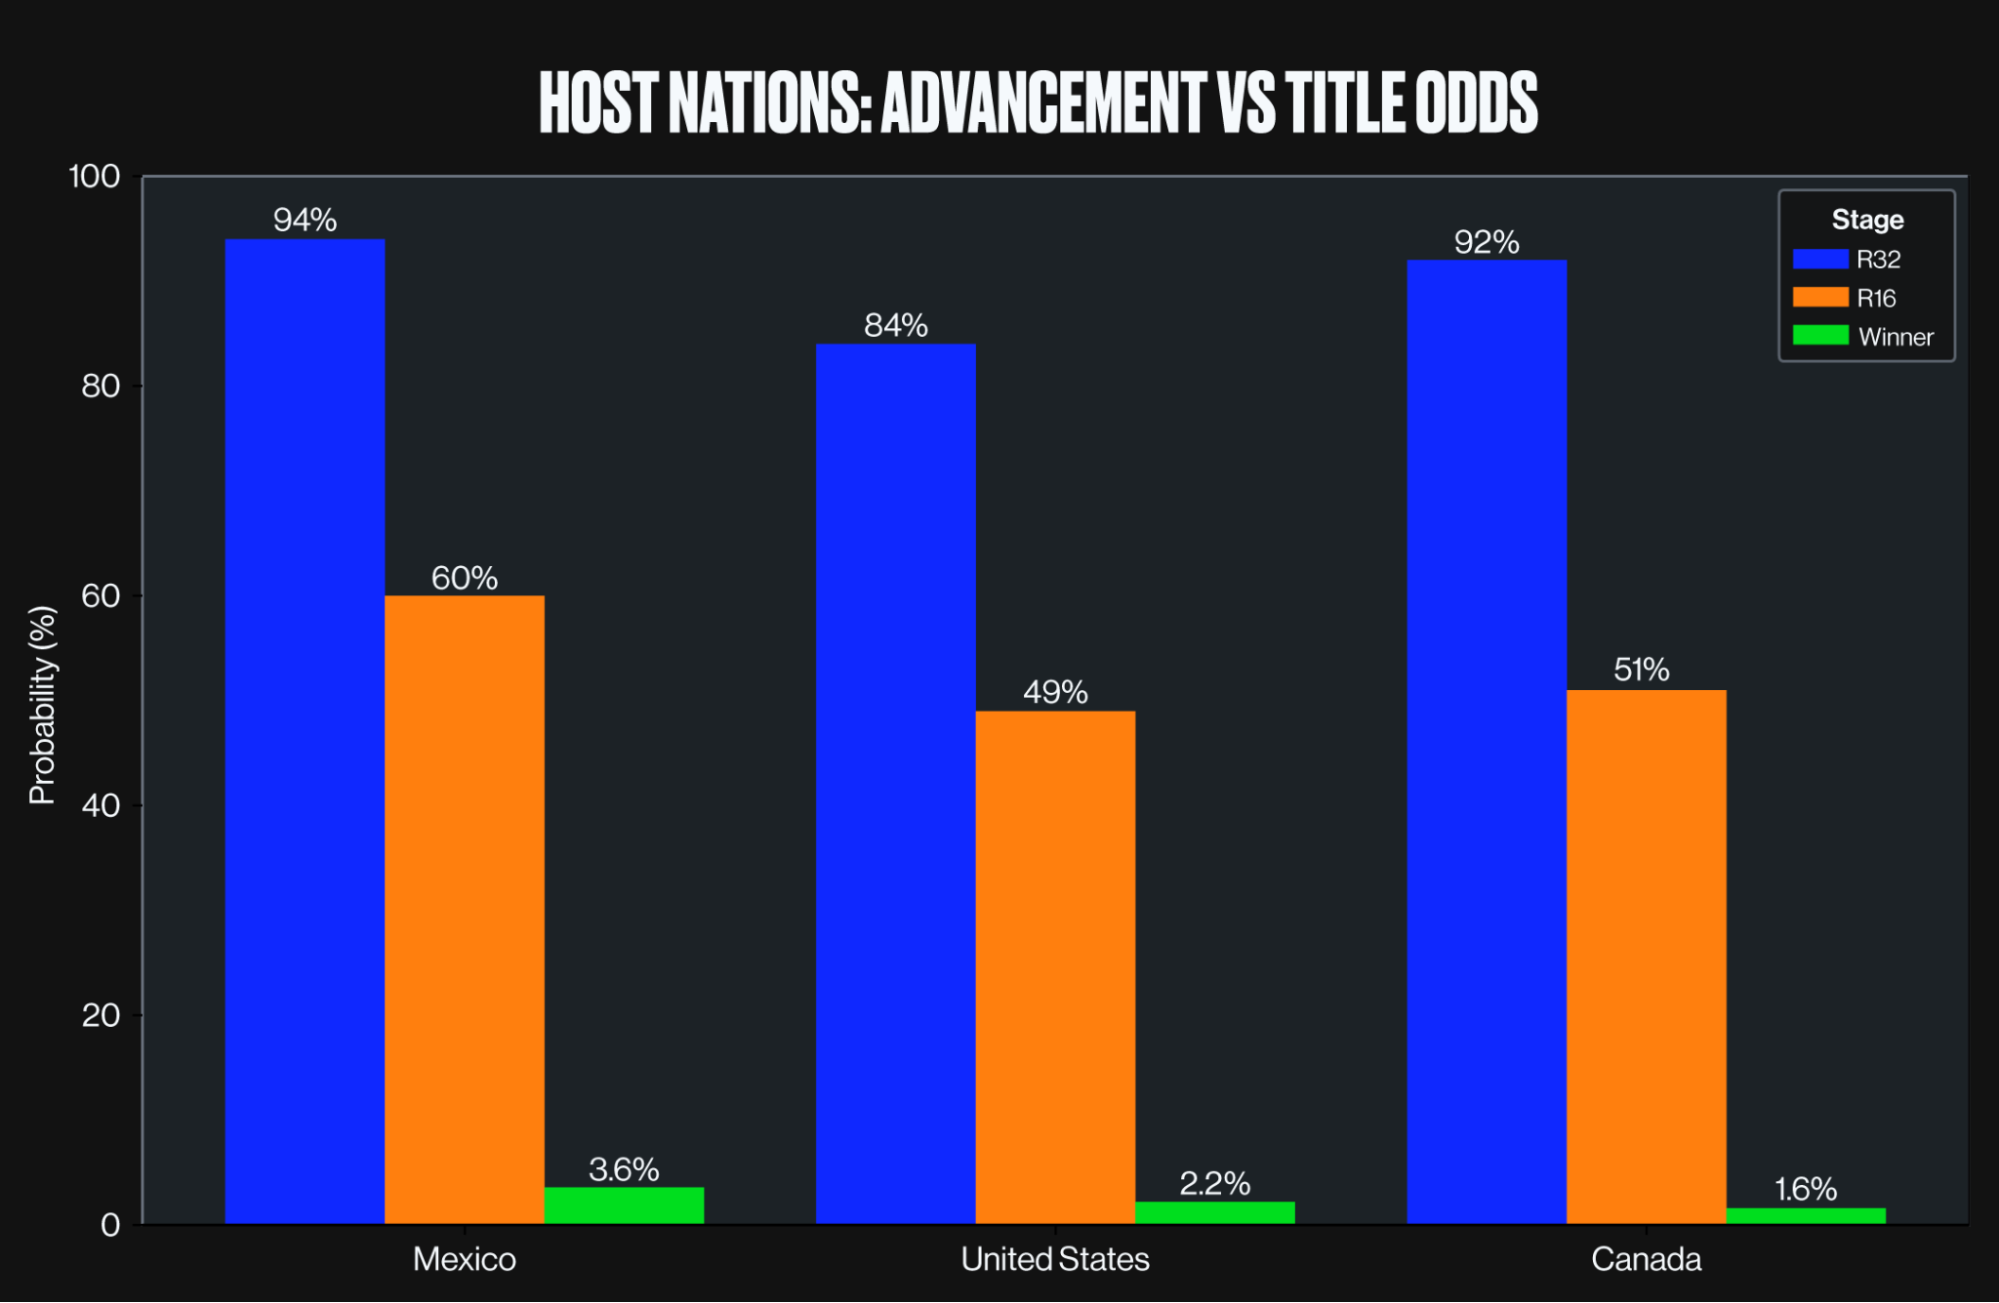
Home advantage gives each host a platform, but the simulations show very different paths from group-stage progression to genuine title contention.
Mexico – 3.6% Mexico carries the strongest title probability of the three hosts, with a 94% chance of reaching the Round of 32 and 60% of reaching the Round of 16. Backed by recent Gold Cup success and the pull of a home crowd, they are the host most likely to turn early advantage into a meaningful run.
United States – 2.2% The United States drew the toughest group of any host and advance from it in just 84% of simulations, below both Mexico and Canada. For Mauricio Pochettino’s side, the tournament could hinge on surviving the group and then finding a way through a difficult early knockout path.
Canada – 1.6% Canada has the lowest title probability of the hosts, despite reaching the Round of 32 in 92% of simulations. The contrast matters: a strong chance of escaping the group, a much steeper climb once the knockouts begin. The model sees a realistic path to advancement, but not to contention.
For all three, the message is the same. Home advantage can build momentum, but it cannot erase the demands of a longer, deeper bracket.
Why the Journey Matters More Than the Winner
The temptation is to fixate on one number: who wins? The more useful story sits in the stage-by-stage path. Data does not remove the uncertainty of a tournament, it organizes it, reading the field as a system of team strength, draw structure, matchup probability, and cumulative risk across every round.
What it cannot do is predict the moments that define a World Cup: the career-defining performance, the late injury, the penalty shootout, the force of a home crowd. But it can show which teams hold the most favorable path, and where a favorite is likely to be tested.
For clubs, leagues, and federations, that is the value of predictive analytics: not to make sport predictable, but to make complex decisions easier to see.
Even the favorite wins fewer than one in five simulations. That is the beauty of the World Cup. Data can tell us who has the clearest path. The game still decides who takes it.