Good decisions shouldn’t wait on setup. Viewer Mode in My iP gives users trusted dashboards, reports, and visualizations they can open, filter, and share from their first login.
As part of the Self-Service Reporting experience in iP: Intelligence Platform, Viewer Mode gives users access to reporting they can use in their day-to-day work, while Creator Mode is where designated users create, configure, and manage the assets behind the experience.
Useful From the First Login
The hardest part of any reporting tool is the blank page. You log in, see an empty screen, and have no idea where to start.
Viewer Mode is built to avoid that. Rather than an empty experience, users open dashboards already mapped to their role. Each one gives them a clear starting point, with connected views across availability, injury trends, athlete readiness, data health, and organizational reporting.
That gives every role somewhere to work from:
- Coaches review availability and the information behind selection and planning.
- Medical practitioners track injury trends, time-loss, and athlete readiness.
- Performance staff monitor load, recovery, and training response.
- Leadership sees a simplified view of the signals shaping decisions across the organization.
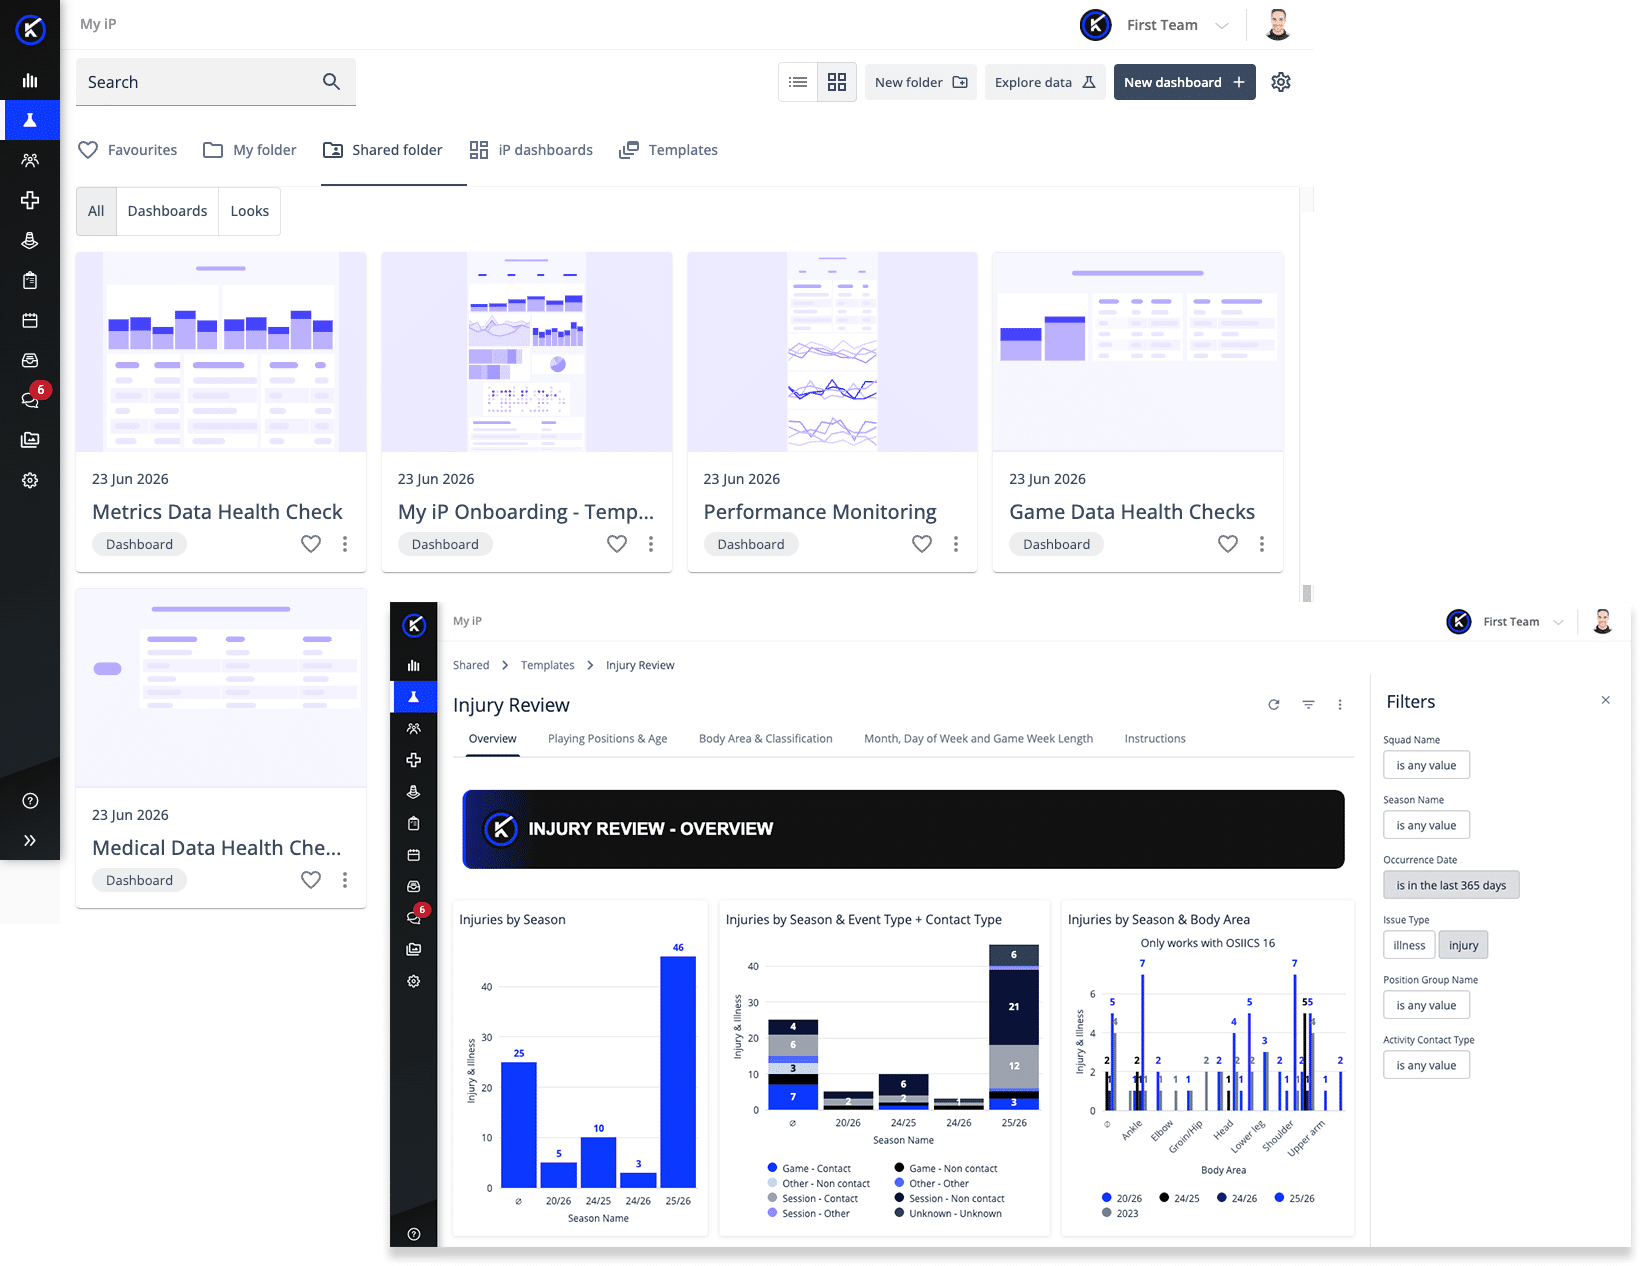
What You Can Do in Viewer Mode
Viewer Mode is built around the way most people use reporting most often: simple, reliable access to the dashboards that show what’s happening and support confident decisions.
Inside Viewer Mode, users can:
- Filter dashboards using the fields available in each view, such as date range, team, athlete group, status, metric, data source, or issue type
- Use available filters to explore trends, comparisons, and patterns from different angles
- Open the dashboards, reports, and templates available to their role
- Use filtered views to support reviews, meetings, and stakeholder updates
- Share, export, print, or present outputs for people who do not log into iP
Personalization happens at the point of use through available filters and shareable outputs. Users can explore and apply the insight without changing the dashboard configuration.
Pivoting, grouping, and widget configuration are handled in Creator Mode, where designated users can edit and manage the dashboards behind the Viewer experience.
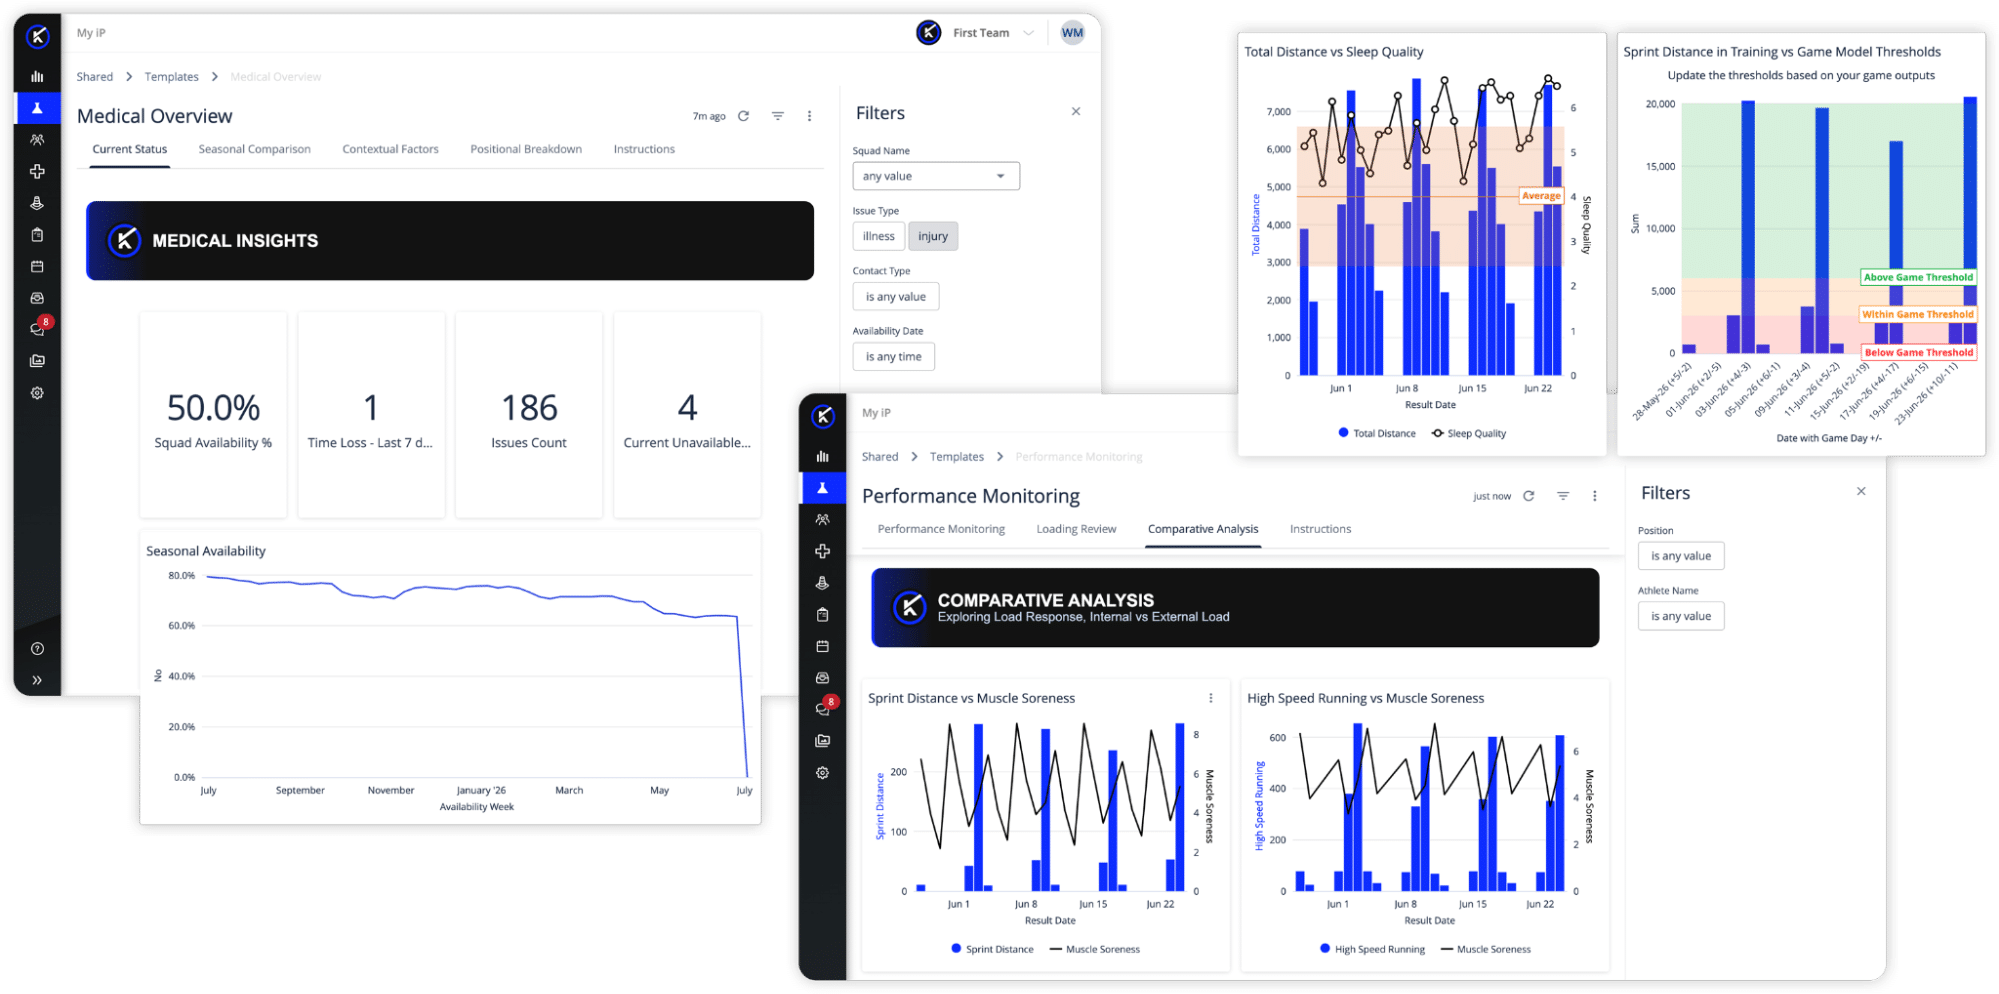
For a closer look at how the two experiences work together, see Viewers and Creators in My iP: The Right Data Experience for Every User.
Not Every Dashboard Works the Same Way on Day One
Some dashboards are ready to use immediately. Others start as templates that show what can be configured and need a Creator to tailor them before they support a wider audience.
That difference comes down to how consistent the underlying data is.
- Injury and illness reporting draws on a more constrained coding library, so those dashboards tend to fit most organizations as they are.
- Workload, wellness, and tracking data vary far more. One team may track wellness on a 1–5 scale, another on 1–10. Providers, metric sets, thresholds, and naming structures can also differ widely.
That is why Performance Monitoring and Metric Data Health Checks are best treated as starting points. They are visible so teams can see what is possible, but they may need a Creator to align the data sources, metrics, thresholds, widgets, and filters before they are useful more broadly.
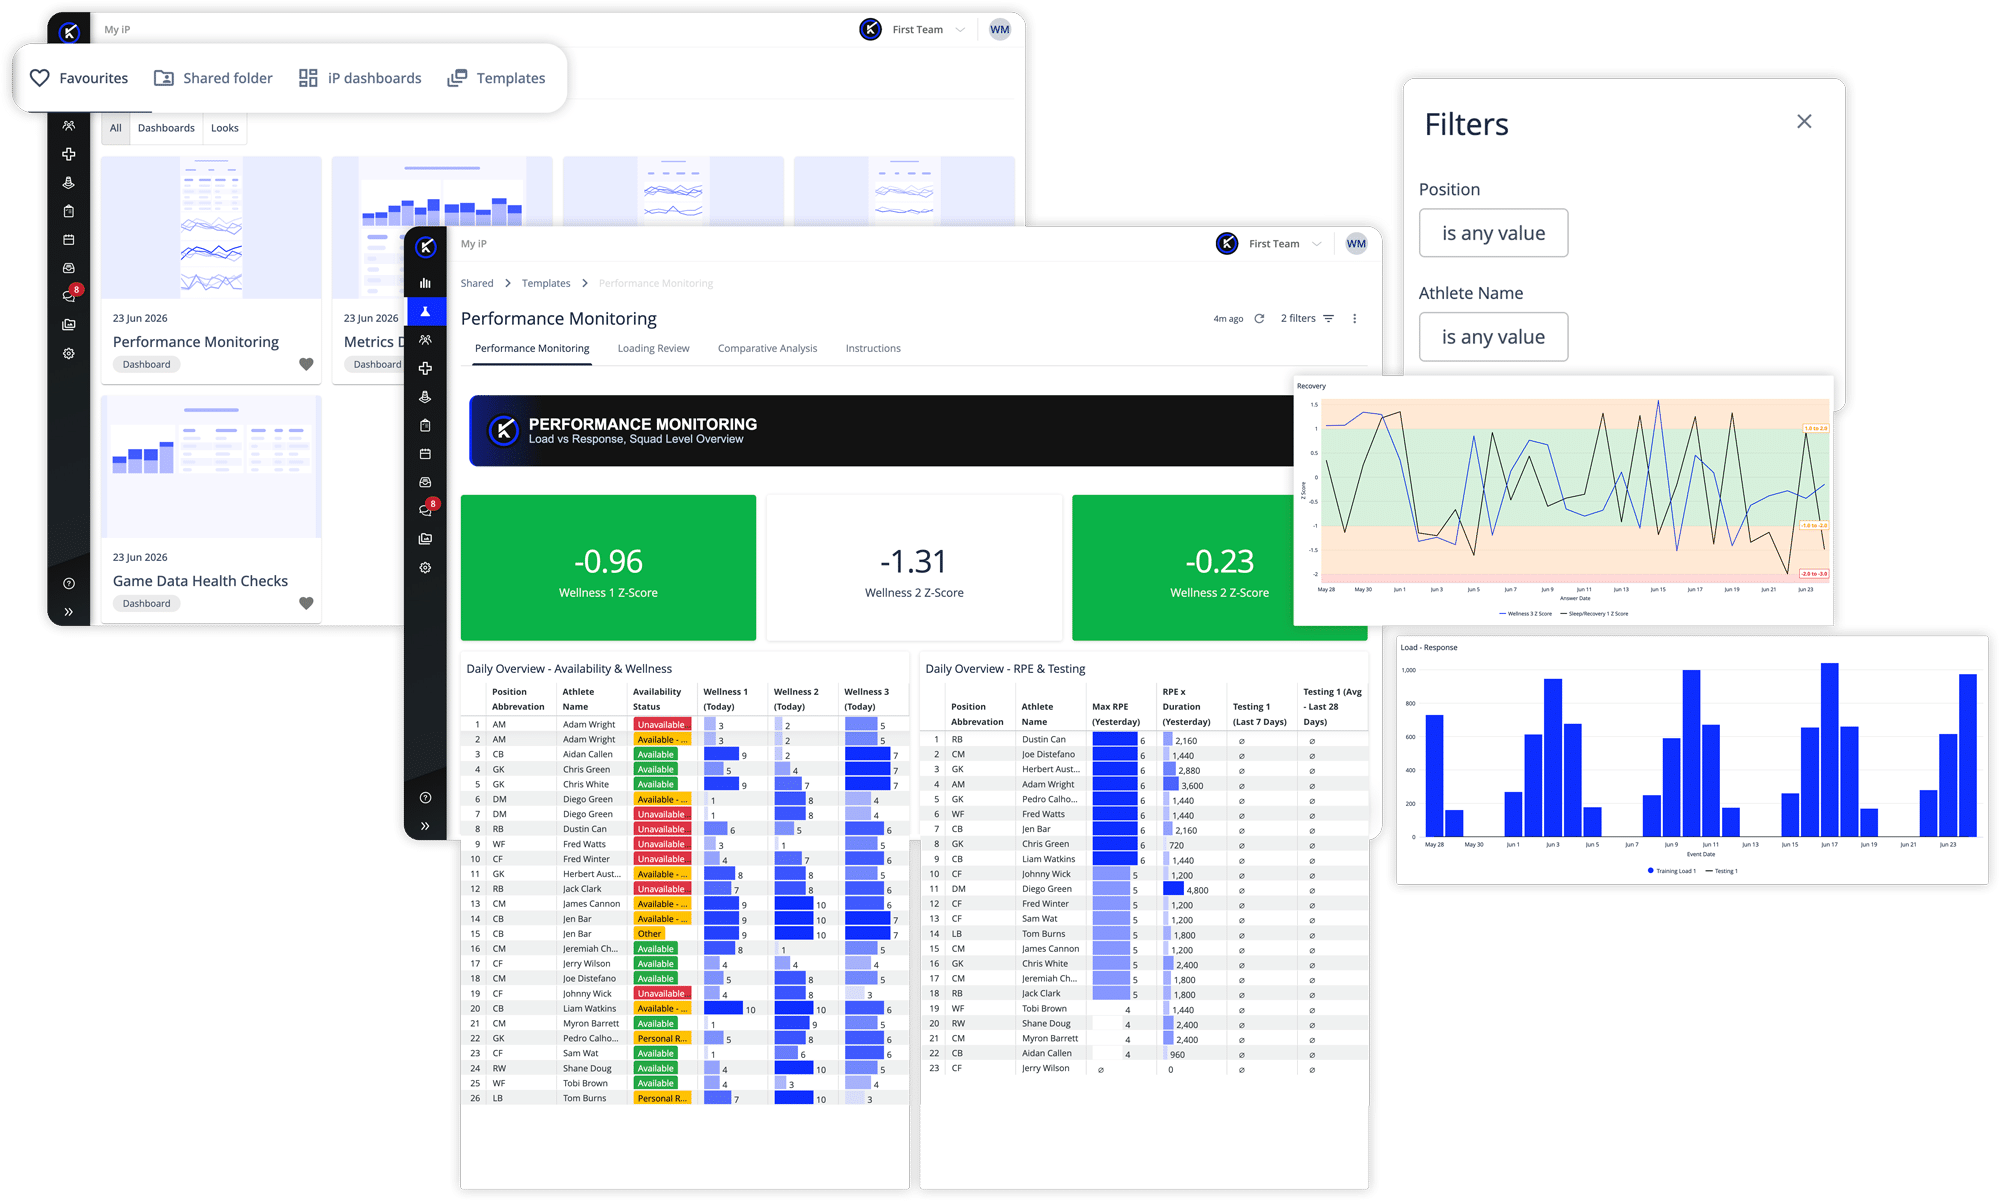
If you open a template and it is not fully aligned to your organization, it usually does not mean something is broken. It means the template is ready to be adapted to how your organization collects and reviews data.
A Creator can copy it, configure it, and share the version that fits. If you are not sure who that is, your platform administrator can point you to the right person.
For a closer look at how designated users create, configure, and personalize reporting, see Creator Mode in My iP: Building the Dashboards Behind Better Decisions.
A Blank Space Is a Signal, Not a Failure
Sometimes an empty widget is the most useful thing on the screen.
It is rarely a sign of a broken dashboard. More often, it points to something specific about your data, and it raises the right questions:
- Is a metric being captured consistently, or do we need to start collecting it?
- Does a source need to be connected?
- Does a workflow need more structure before the dashboard can fully support the decision?
- Does the underlying data need to be reviewed before it can be trusted in reporting?
That is where Viewer Mode ties back to data health.
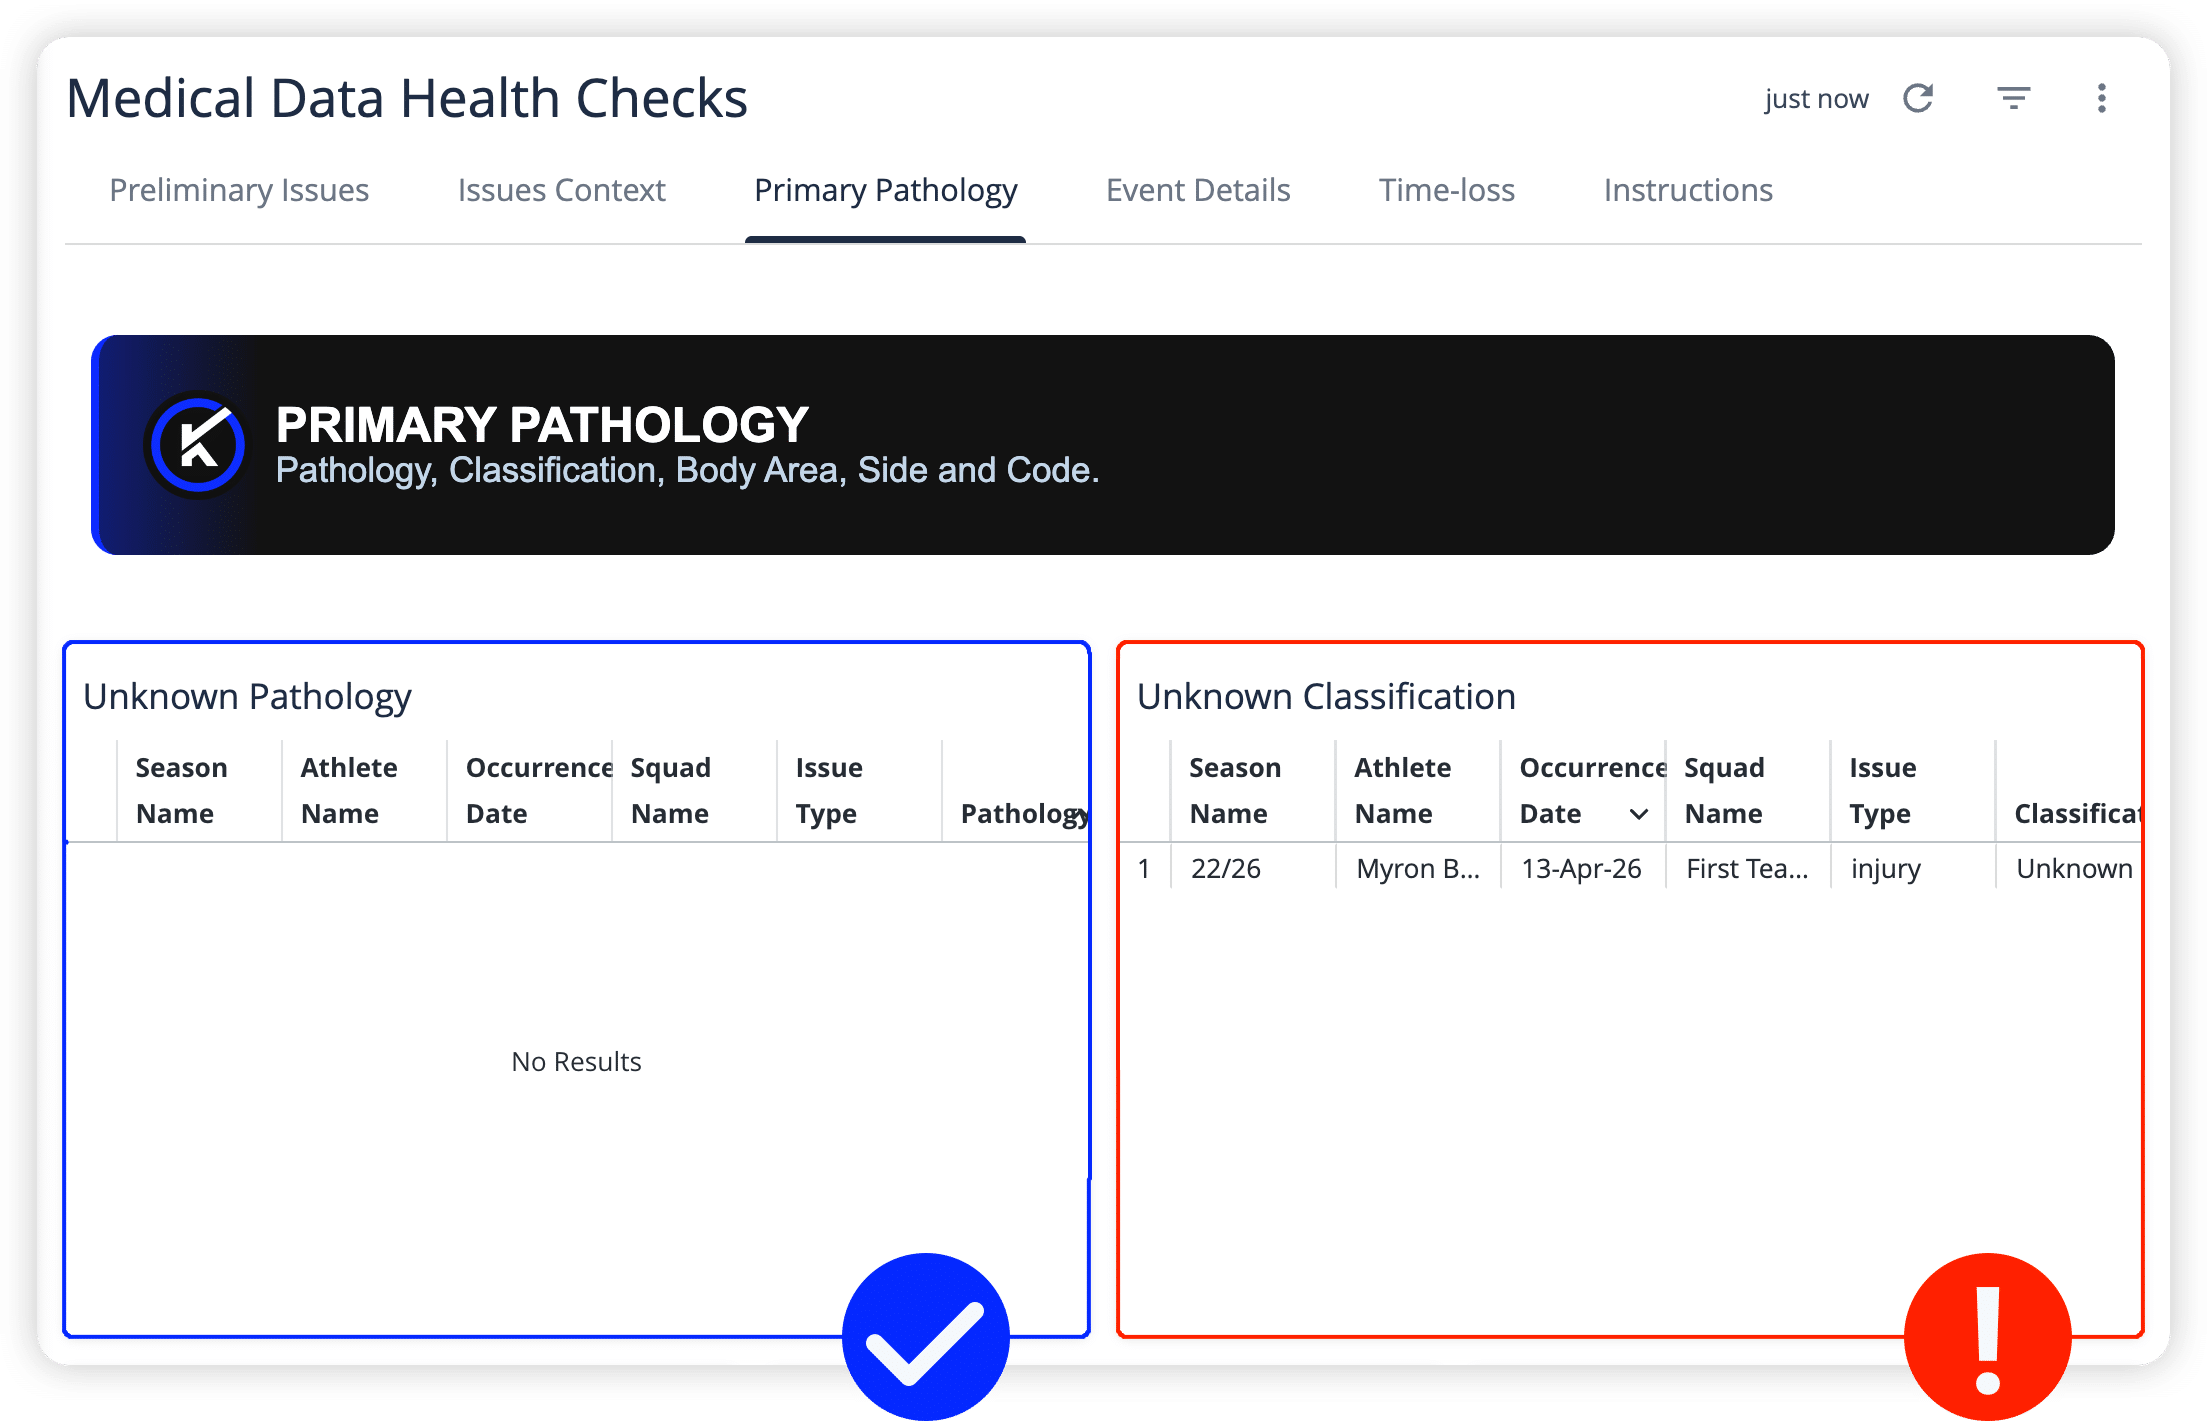
The Data Health Dashboards in My iP help teams answer those questions by surfacing gaps, inconsistencies, and anomalies across athlete, game, medical, and metrics data.
What looks like a gap becomes a prompt to strengthen the data behind every report.