Smarter Performance Analysis with Self-Service Reporting in iP: Intelligence Platform
Harness the power of intuitive, flexible reporting to drive performance comparison and benchmarking.
In elite sports, timely and data-driven decisions can be the difference between good and great performance. Teams and organizations must continuously evaluate and compare key performance metrics to optimize training, reduce injury risk, and improve overall outcomes. However, extracting meaningful insights from vast amounts of data can be complex and time-consuming—until now.
Self-Service Reporting in iP: Intelligence Platform empowers performance practitioners with intuitive, flexible, and dynamic reporting capabilities that streamline performance comparison and benchmarking. The latest enhancements—Charts+ and the Formula Feature in Tables—take these capabilities even further, allowing users to analyze, compare, and benchmark data more effectively than ever before.
Data-Driven Decisions, Simplified
Gone are the days of static reports and manual data exports. Self-Service Reporting in iP provides:
- Expansive access to diverse data types—including metric data, game data, medical data, session activity, participation, and availability.
- Advanced comparative analysis—with the ability to group data in multiple ways, such as by athlete, position, squad, or time.
- A seamless user experience—where reports are built, edited, and iterated in real time within the same dashboard.
With these features, organizations can quickly surface the insights they need to make informed performance decisions.
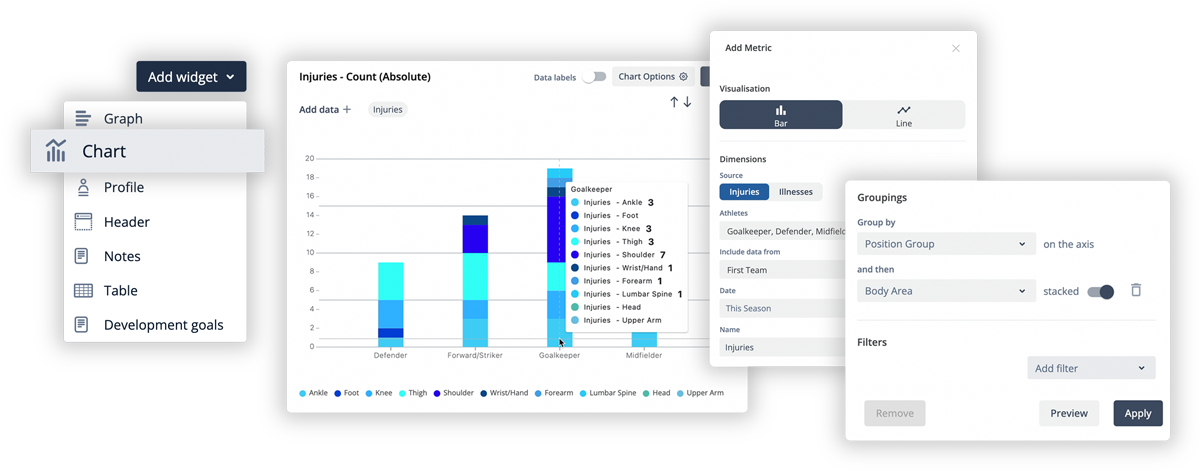
Enhanced Visualization with Charts+
Performance analysis is most effective when data is presented clearly and contextually. With the new Charts+ capability, users can:
- Choose from a range of visualizations, including bar charts, stacked columns, and line series.
- Configure charts directly within the dashboard, eliminating the need to navigate multiple screens.
- Apply multiple groupings—such as total distance grouped by time and position—to enable deeper comparative analysis.
- Instantly preview charts in the dashboard, making iteration fast and efficient.
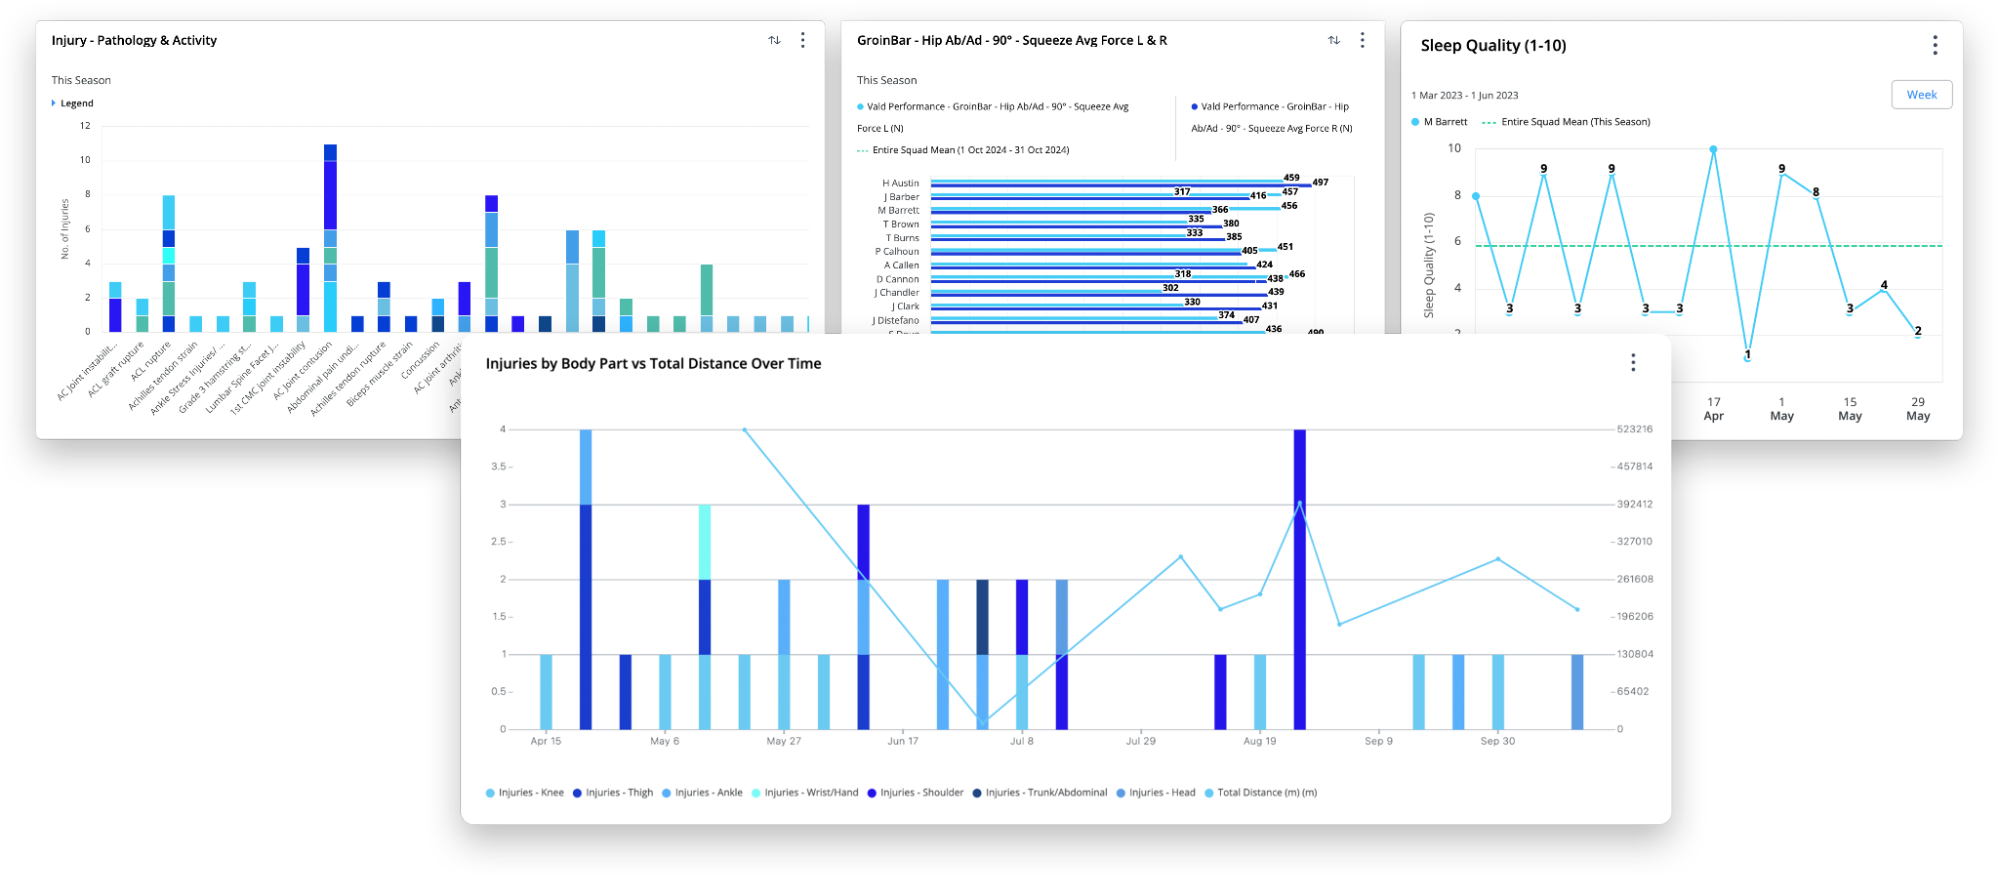
This enhancement transforms raw data into actionable intelligence, making it easier for teams to track performance trends and uncover meaningful insights.
Unlocking Benchmarking Power with the Formula Feature in Tables
Effective benchmarking requires dynamic comparisons across various data points. The Formula Feature in Tables enables users to:
- Perform relative and comparative analysis by calculating key performance indicators within a single report.
- Compare an athlete’s current performance against historical data, enabling year-over-year analysis.
- Benchmark athlete data against squad averages or positional norms, supporting individualized development plans.
- Apply event-specific filters, ensuring contextually relevant analysis for competitions, training sessions, or recovery periods.
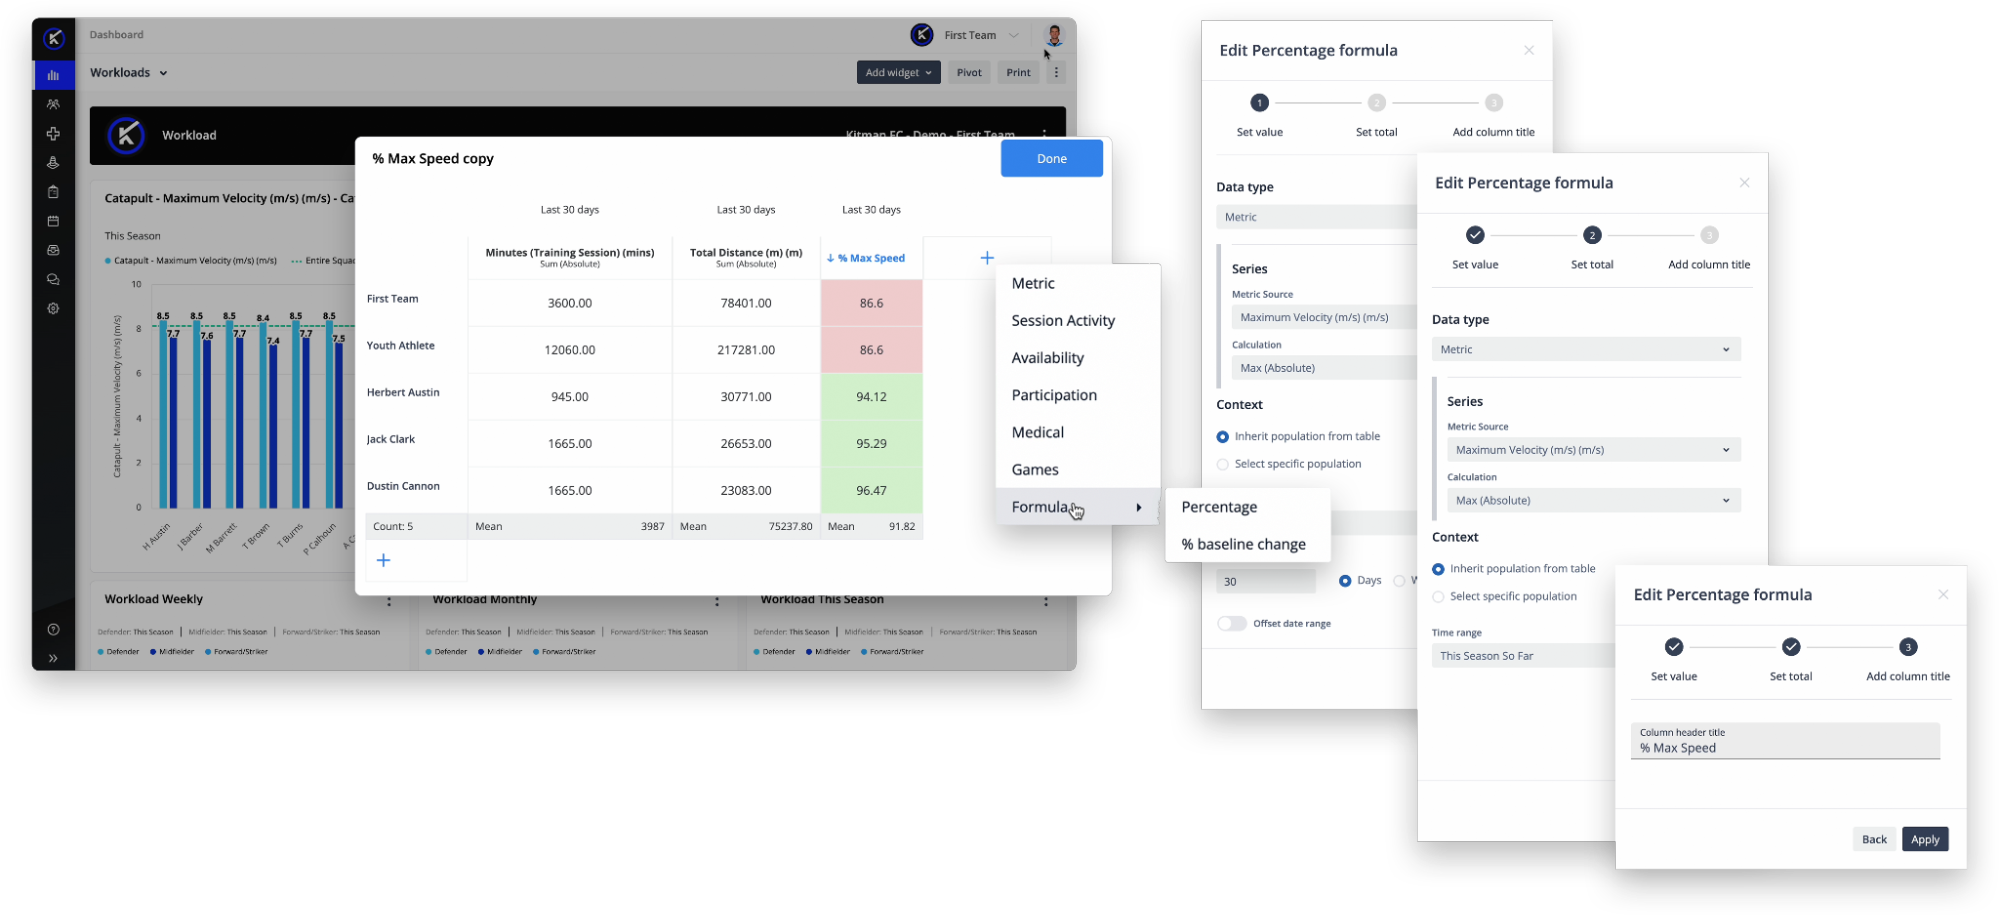
For example, teams can quickly determine what percentage of their max velocity an athlete achieved during a session—providing immediate insights into workload and performance trends.
Use Cases: Performance Comparison & Benchmarking
With Self-Service Reporting, organizations can tailor their analysis to meet their specific performance objectives. Here are a few practical applications:
Athlete Performance Benchmarking
Practitioners can compare an athlete’s performance against their peers in the same position or squad. For instance, by leveraging Charts+, users can analyze key GPS metrics such as:
- Total Distance
- Max Speed
- Acceleration & Deceleration
- High-Speed Running
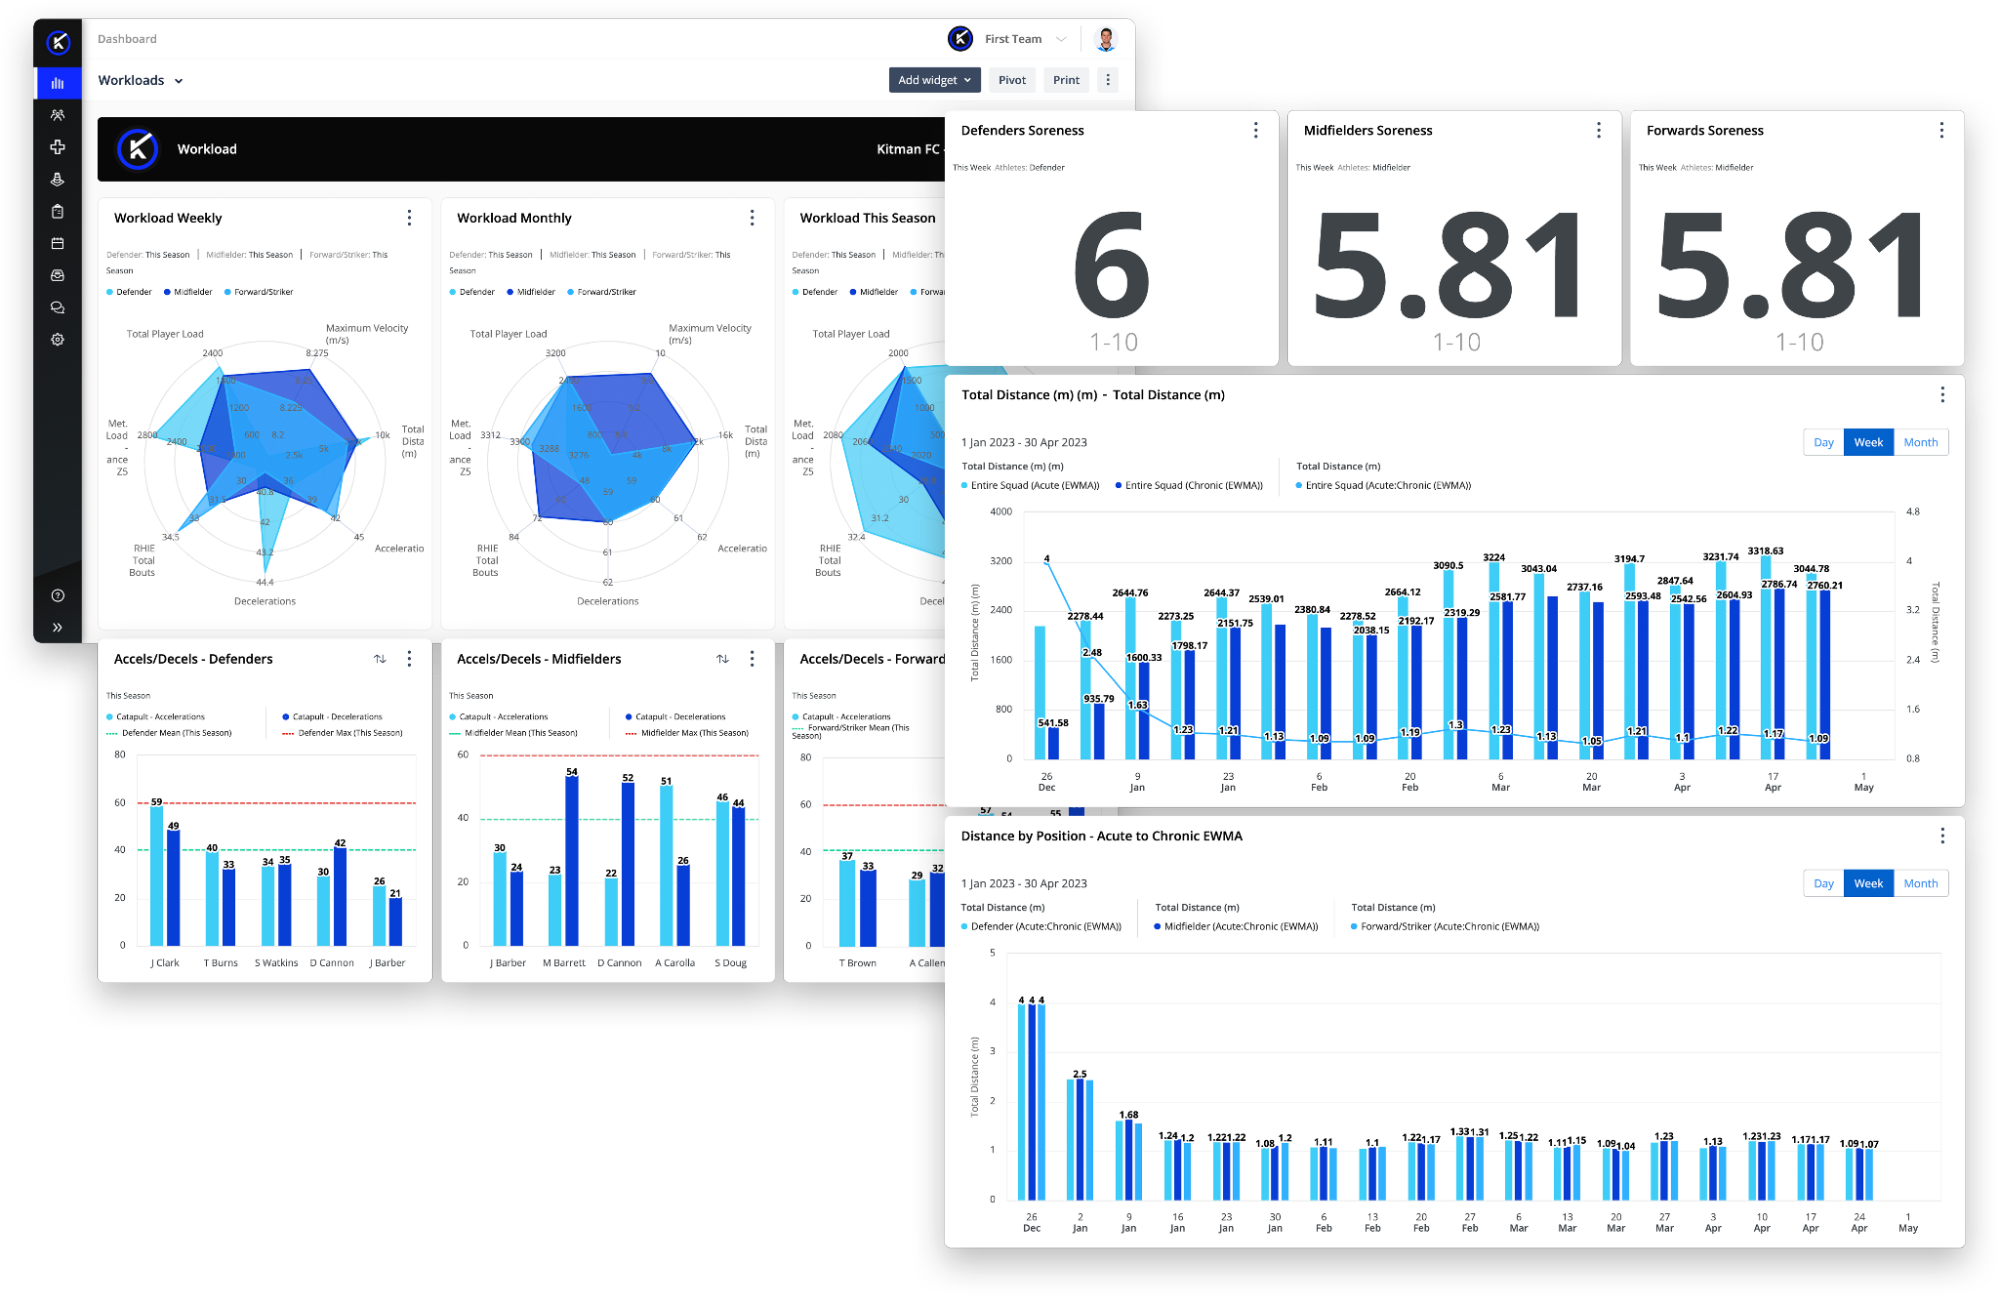
These comparisons provide critical insights into athlete development, workload management, and competition readiness.
Year-Over-Year Performance Tracking
Understanding longitudinal performance trends is crucial for athlete progression. With Self-Service Reporting, organizations can:
- Compare an athlete’s key performance metrics from the same competition in previous seasons.
- Identify performance improvements or declines over time.
- Optimize training interventions based on past performance data.
Daily Monitoring & Readiness Assessment
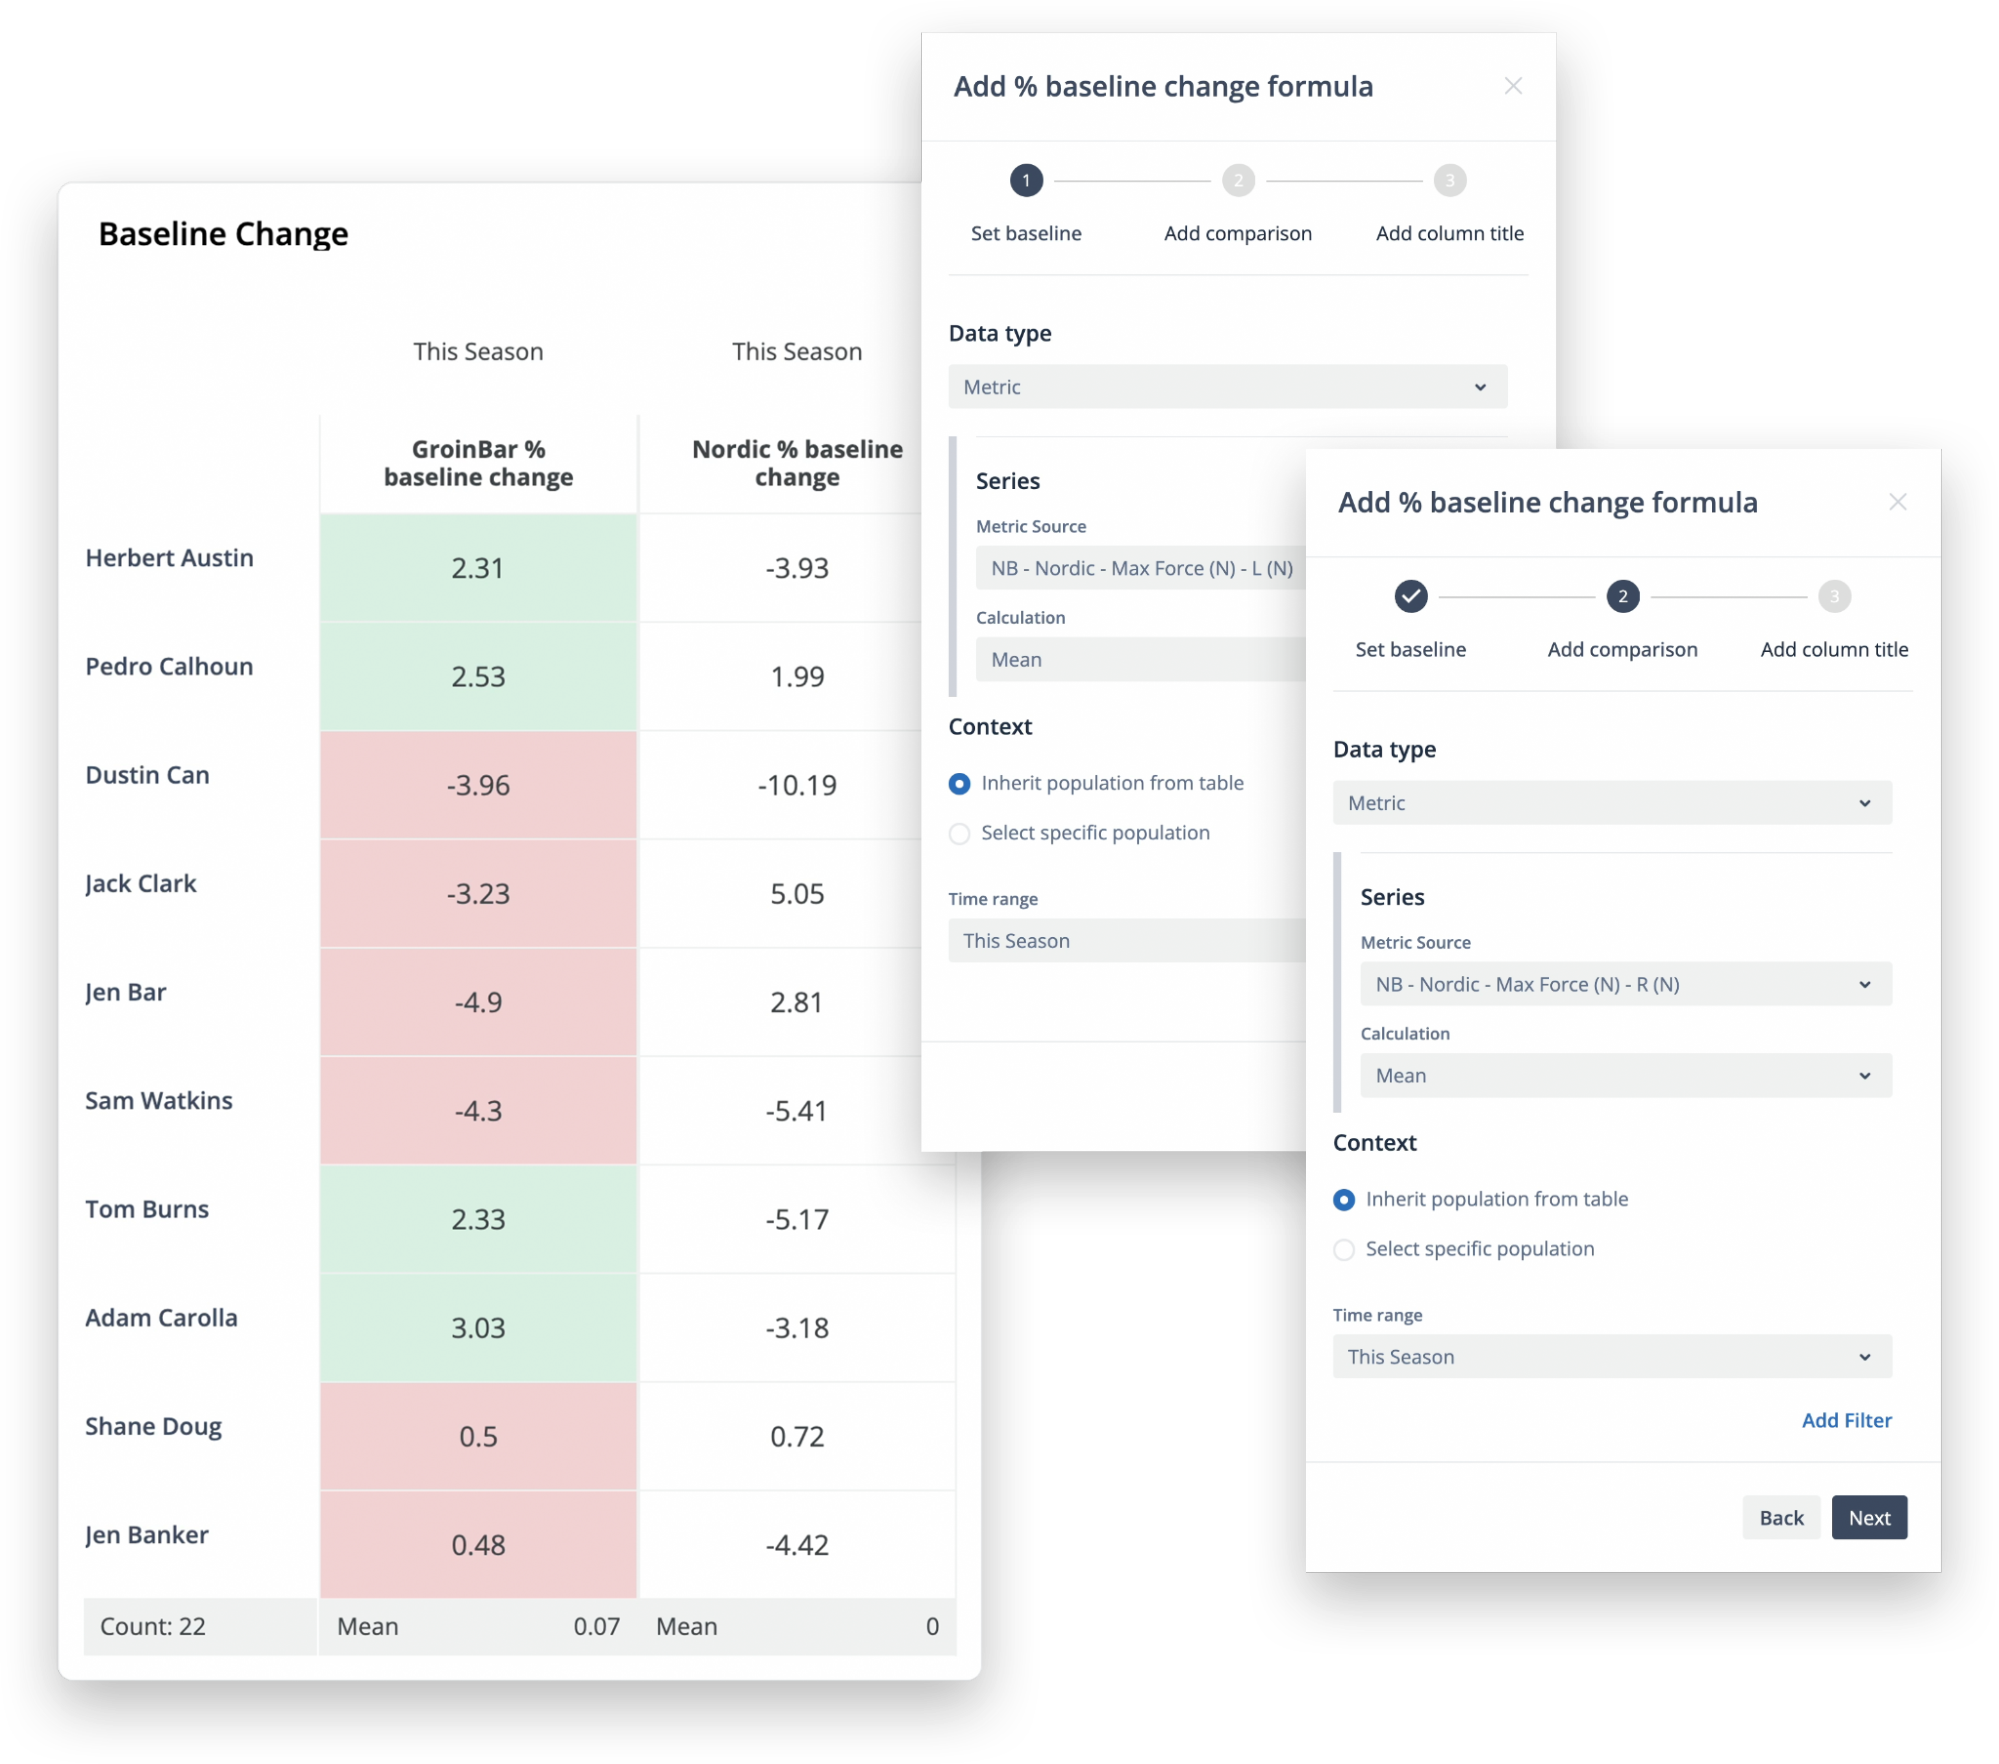
Using the Formula Feature in Tables, teams can track key monitoring metrics like Nordbord and Groinbar data over time. This enables:
- Daily workload assessments to gauge an athlete’s response to training.
- Baseline percentage changes to detect fluctuations and potential injury risks.
- Customized reports that integrate multiple data sources into a unified view of athlete readiness.
Game Event Data Analysis
Performance isn’t just about physical metrics—it’s also about game impact. Self-Service Reporting allows teams to analyze game event data, such as:
- Goals scored
- Assists
- Time in position
- Cards received

These insights help coaches and performance staff evaluate game contributions, tactical effectiveness, and player development.
See the Performance Comparison & Benchmarking Dashboard in Action
Watch how the Self-Service Reporting capabilities in iP: Intelligence Platform help Performance Science Teams compare and benchmark athlete metrics to drive informed decisions. By analyzing key data such as speed, distance, and workload, teams can identify trends, evaluate benchmarks, and track progress over time. This supports event-specific analysis and historical comparisons, enabling teams to effectively refine training and optimize athlete performance.